Trump Tariffs Will Raise the Cost of Food for Americans
The Trump tariffs will likely raise the cost of food for Americans, particularly for liqueurs and spirits, baked goods, coffee, fish, and beer.
4 min readStay informed with quick and accessible analysis of today's top tax policy topics. Read Tax Foundation's Tax Policy Blog for insight from our experts on tax policies across the U.S. and abroad.
To find our most recent research papers and data, click the links below.

The Trump tariffs will likely raise the cost of food for Americans, particularly for liqueurs and spirits, baked goods, coffee, fish, and beer.
4 min read
Even when international relations are frayed, there is value in finding ways to combat corporate profit shifting while also fostering a healthy commercial atmosphere and positive trade relations.
7 min read
Rather than adopt temporary policies that phase out and expire, policymakers should focus their efforts on long-term reforms to support investment.
7 min read
However states choose to respond to other tax provisions of the One Big Beautiful Bill Act, they should conform to the pro-growth provisions, which represent a marked improvement in the corporate tax code.
12 min read
Several major new tax breaks are scheduled to expire at the end of 2028, setting the stage for another tax fight to either extend them or allow them to expire.
5 min read
Oklahoma can continue to enhance its competitiveness by pursuing a variety of reforms to the corporate and individual income tax, but it should avoid policies that would negatively impact the economy, like enacting a wholesale elimination of the property tax.
6 min read
The European Commission proposed new budget options for 2028 to 2034. It is worth zooming in on one new proposal for revenues that would support EU-level spending. The “Corporate Resource for Europe,” or CORE, provides a good opportunity to think through how best to raise revenue for the EU budget.
5 min read
If the federal government really wanted to make saving more accessible for taxpayers, it would swap the proposal for Trump Accounts to replace the complicated mess of savings accounts currently available with universal savings accounts.
5 min read
Our analysis finds that the Trump tariffs threaten to offset much of the economic benefits of the new tax cuts, while falling short of paying for them.
3 min read
Sean Bray interviews Dr. Michele Chang, Director of the Masters in Transatlantic Affairs and Professor of European Political Governance at the College of Europe, about the future of the EU tax mix.
12 min read
The One Big Beautiful Bill Act makes many of the individual tax cuts and reforms of the TCJA permanent. It improves upon the TCJA by making expensing for R&D and equipment permanent. However, for the most part, it does not include further structural reforms, and instead introduces many new, narrow tax breaks to the code, adding complexity and raising revenue costs.
7 min read
Alabama’s 2025 legislative session mostly demonstrates a commitment to pro-growth tax policies that enhance competitiveness and reduce compliance burdens.
4 min read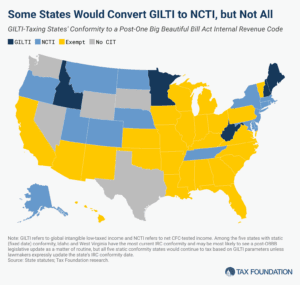
The One Big Beautiful Bill’s changes to the taxation of international income have surprising implications for state codes, yielding tax increases and a revised tax base that, through quirks of state incorporation, bears very little resemblance to the federal base and almost nothing of its purpose.
10 min read
Policymakers continue to debate international tax rules after the US gained agreement on a new approach at the G7 that could result in US anti-avoidance policies existing side-by-side with the global minimum tax.
4 min read
While well-designed excise taxes can make society better off, some of the health taxes proposed by the WHO use a pretty façade to cover for policies that fail to deliver their promised benefits.
5 min read
The increased senior deduction with the phaseout would deliver a larger tax cut to lower-middle- and middle-income taxpayers compared to exempting all Social Security benefits from income taxation and would not weaken the trust funds as much. But given the temporary nature of the policy, it would increase the deficit-impact of the reconciliation bills without boosting long-run economic growth.
3 min read
With reports that Republican legislative leaders and Wisconsin Gov. Evers (D) have reached a budget deal for FY 2026 and 2027, it is worth examining two significant tax relief proposals included in the plan.
7 min read
Independence Day is notable for its insistence not just on light taxation, but more importantly on taxation being subject to the consent of the governed through a representative form of government.
4 min read
Tax Foundation Europe’s Sean Bray interviews Dr. Monika Köppl-Turyna, director of the EcoAustria Institute for Economic Research, about the future of the EU tax mix.
14 min read
Lawmakers should consider maintaining QBAI and applying the several billion dollars from the Senate’s change toward other pro-growth international tax reforms instead.
6 min read