Key Findings
- Recent debates over income inequality have focused on the role of higher income taxA tax is a mandatory payment or charge collected by local, state, and national governments from individuals or businesses to cover the costs of general government services, goods, and activities. rates during the 1930’s through the 1980s. Some assert these higher rates reduced income inequality, relative to today, when income tax rates are significantly lower.
- These arguments fail to consider that the high individual tax rates from 1950 through 1980 largely drove entrepreneurial business income out of the individual income taxAn individual income tax (or personal income tax) is levied on the wages, salaries, investments, or other forms of income an individual or household earns. The U.S. imposes a progressive income tax where rates increase with income. The Federal Income Tax was established in 1913 with the ratification of the 16th Amendment. Though barely 100 years old, individual income taxes are the largest source of tax revenue in the U.S. system and into the corporate income taxA corporate income tax (CIT) is levied by federal and state governments on business profits. Many companies are not subject to the CIT because they are taxed as pass-through businesses, with income reportable under the individual income tax. system.
- This phenomenon reversed itself during the 1980s when the top individual income tax rate fell below the corporate rate and restrictions on the structure and participation in partnerships and S corporations eased.
- These trends suggest that the high personal income rates from 1950 through 1980 simply encouraged the rich to modify the composition of their income. Their wealth was still there during this period, it was just not accounted for on individual tax returns. The shifting composition of income claimed by the rich due to changes in tax laws explains this illusion.
- Focusing solely on the individual income tax data leads to a misjudgment on the historic level of inequality.
Introduction
In a recent essay in the New York Times, economists Emmanuel Saez and Gabriel Zucman argue that the 70 percent income tax rate proposed by Rep. Alexandria Ocasio-Cortez (D-NY)is not about soaking the rich, it is about “regulating inequality and the market economy” and constraining “the immoderate, and especially unmerited, accumulation of riches.” Lastly, they say, “It is also about safeguarding democracy against oligarchy.”[1]
That is a lot to ask of any tax system. However, according to Saez and Zucman, the U.S. tax code achieved these objectives during the era from 1930 to 1980 when “the top marginal tax rateThe marginal tax rate is the amount of additional tax paid for every additional dollar earned as income. The average tax rate is the total tax paid divided by total income earned. A 10 percent marginal tax rate means that 10 cents of every next dollar earned would be taken as tax. averaged 78 percent; it exceeded 90 percent from 1951 to 1963.” As a result, they say, the “United States came as close as any democratic country ever did to imposing a legal maximum income. The inequality of pretax income shrunk dramatically.”
There is a considerable amount of debate whether these high income tax rates actually reduced inequality. One study cautioned that inequality studies based on tax return data are “biased by tax baseThe tax base is the total amount of income, property, assets, consumption, transactions, or other economic activity subject to taxation by a tax authority. A narrow tax base is non-neutral and inefficient. A broad tax base reduces tax administration costs and allows more revenue to be raised at lower rates. changes and missing income sources.”[2] A major factor to be considered is how the composition of reported income for the rich has changed over time in response to multiple changes in individual tax rates and the difference between those rates and the corporate tax rate.
Stay informed on the tax policies impacting you.
Subscribe to get insights from our trusted experts delivered straight to your inbox.
SubscribeAs we will see, the high individual tax rates from 1950 through 1980 largely drove entrepreneurial business income out of the individual income tax system and into the corporate income tax system. It is likely that there were no fewer rich people during those decades than today, but many of them simply sheltered their income in traditional C corporations, which faced considerably lower tax rates. It is likely that what Saez and Zucman see as a reduction in inequality during that era is merely the migration of business income from individual income tax forms and onto corporate tax forms.
This phenomenon reversed itself during the 1980s when the top individual income tax rate fell below the corporate rate and the restrictions on the structure and participation in partnerships and S corporations eased. This resulted in an explosion of so-called pass-through businessA pass-through business is a sole proprietorship, partnership, or S corporation that is not subject to the corporate income tax; instead, this business reports its income on the individual income tax returns of the owners and is taxed at individual income tax rates. es, such as partnerships, S corporationAn S corporation is a business entity which elects to pass business income and losses through to its shareholders. The shareholders are then responsible for paying individual income taxes on this income. Unlike subchapter C corporations, an S corporation (S corp) is not subject to the corporate income tax (CIT). s, and sole proprietorships that has continued through today. Income that historically would have been reported on a corporate 1120 tax form is now being reported on individual 1040 tax forms, giving the appearance of a rise in inequality.
Saez’s Own Data Shows How High Tax Rates Impact Entrepreneurial Income
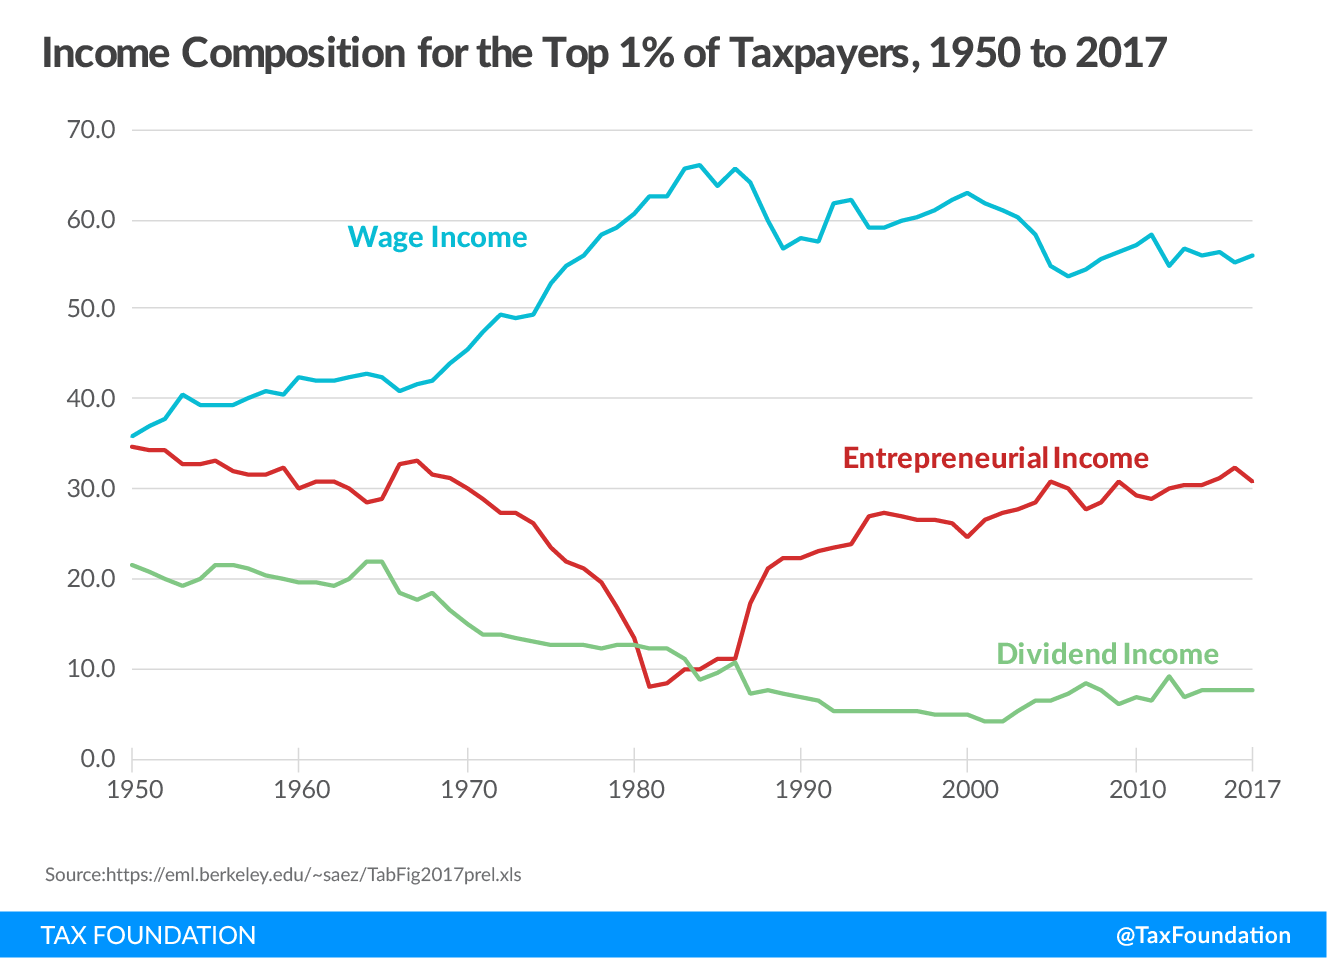
The effect of changes in tax rates on income shifting is evident in data that Saez makes available on his website. Figure 1 (below), based on Piketty-Saez data, illustrates the changing composition of income for the top one percent of taxpayers from 1950 to 2017.
In 1950, when the top individual tax rate was 91 percent, the richest taxpayers claimed roughly equal amounts of wage income and entrepreneurial income (Saez’s term for pass-through business income). Over the next thirty years, as high income tax rates persisted, the percentage of entrepreneurial income claimed by the rich dropped from roughly 35 percent in 1950 to 7.8 percent in 1981. The likely cause was the gulf between the top individual tax rate and the corporate tax rate.[3]
During the 1950s, the top tax rate on traditional C corporations was 52 percent, some 39 points lower than the top individual income tax rate. The Kennedy tax cuts in 1963 lowered the top individual tax rate to 70 percent and the corporate rate to 48 percent. As the Figure 1 indicates, the lower individual rate appears to have encouraged the rich to claim more entrepreneurial income during the latter half of the 1960s, but that surge was short-lived.
As the 22 percentage point difference between the top individual income tax rate and the corporate rate persisted throughout the 1970s, the rich claimed less and less entrepreneurial income as a share of their overall income. The decline accelerated after 1979 when the top corporate tax rate was lowered to 46 percent and capital gains rates were cut. Over the next three years, the share of entrepreneurial income claimed by the rich dropped by more than half, from about 20 percent in 1978 to 7.8 percent in 1981.
Figure 1.
 progressive taxA progressive tax is one where the average tax burden increases with income. High-income families pay a disproportionate share of the tax burden, while low- and middle-income taxpayers shoulder a relatively small tax burden.
code, U.S. income tax code Saez and Zucman 70 percent tax rate” />
progressive taxA progressive tax is one where the average tax burden increases with income. High-income families pay a disproportionate share of the tax burden, while low- and middle-income taxpayers shoulder a relatively small tax burden.
code, U.S. income tax code Saez and Zucman 70 percent tax rate” />
Stay informed on the tax policies impacting you.
Subscribe to get insights from our trusted experts delivered straight to your inbox.
SubscribeThe Reagan Tax Cuts Made Reporting Entrepreneurial Income More Attractive
The Economic Recovery Tax Act (ERTA) of 1981 cut the top individual income tax rate from 70 percent to 50 percent while keeping the corporate tax rate at 46 percent. The capital gains rate also fell from 28 percent to 20 percent. The Saez chart above shows that the big cut in the individual tax rate halted the downward trend in the amount of entrepreneurial income claimed by the rich. This change was also fueled by an expansion in the allowable number of shareholders for S corporations and the creation of the new class of limited liability corporations (LLCs).
The spark that altered the entire way that business income is reported on tax returns today was the Tax Reform Act of 1986, which lowered the top individual tax rate from 50 percent to 28 percent, lower than the newly enacted 34 percent rate on corporate income. As the chart above demonstrates, the amount of entrepreneurial income claimed by the rich on 1040 forms soared almost immediately.
According to Saez’s data, the share of the wealthy’s income from entrepreneurial sources doubled from 11.1 percent in 1986 to 22.3 percent by 1989. At the same time, the share of their income attributable to wages dropped from 65.7 percent in 1986 to 56.7 percent in 1989.
Saez’s data shows that entrepreneurial income for the rich peaked at 32.2 percent of total income in 2016. The last time the rich claimed that much entrepreneurial income was in 1958, nearly 60 years earlier.
1986 Caused a Tectonic Shift in Business Forms and Income
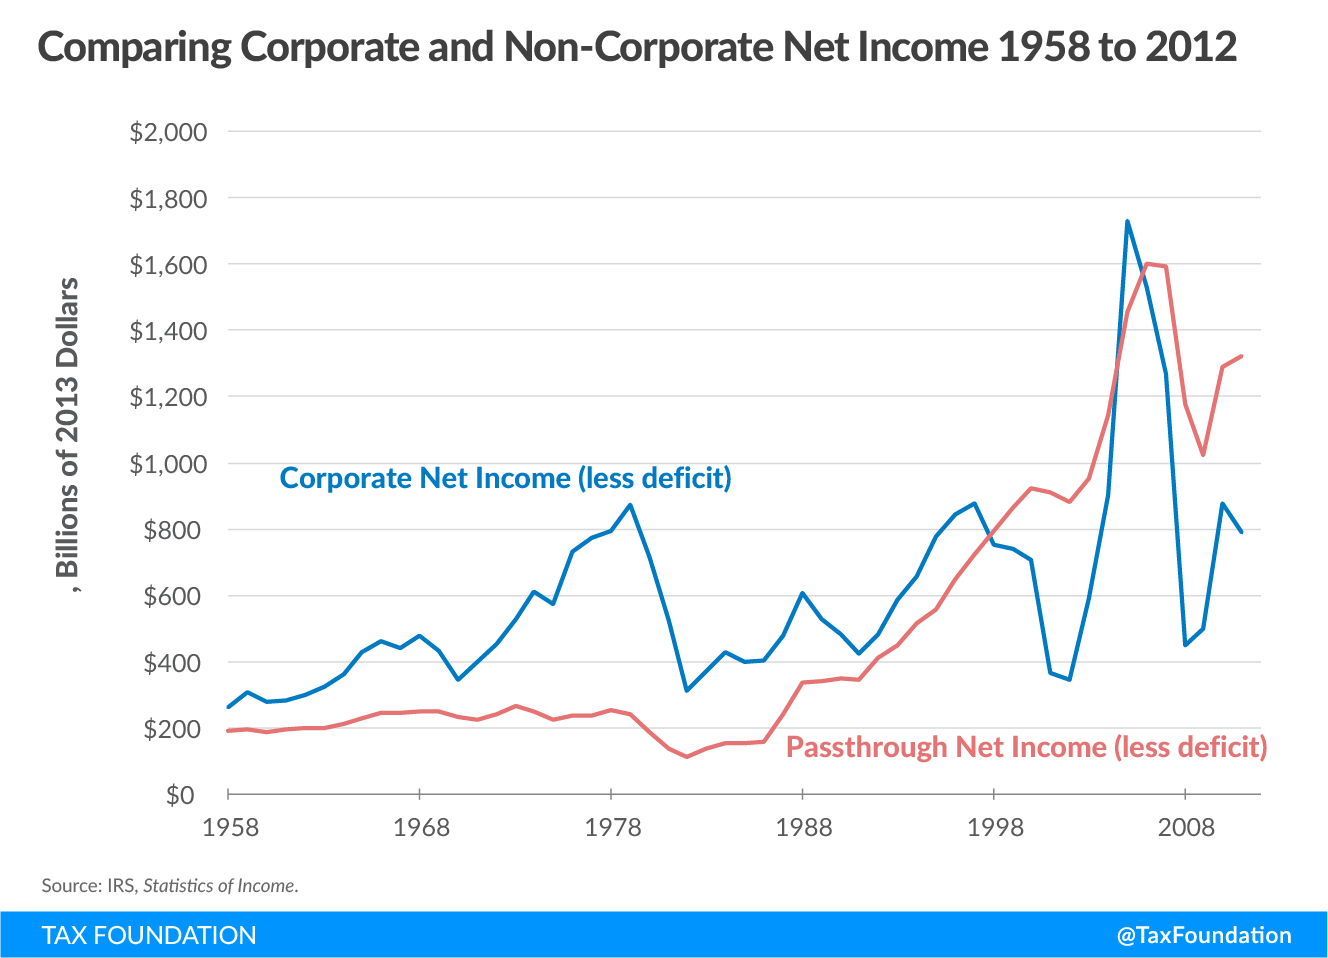
As we will now see in Statistics of Income Data from the IRS, the Tax Reform Act of 1986 had a dramatic impact on the composition of business forms in America and where the income earned by those firms would be taxed. Due to the rapid growth in pass-through businesses after 1986, there is more business income claimed today on individual 1040 tax forms than on traditional corporate 1120 forms. In fact, as the chart below shows, the total amount of income earned by pass-through businesses has exceeded the amount earned by C corporations for much of the past 20 years.
Looking at the decades prior to the Reagan tax cuts, we can see that overall entrepreneurial profits were stagnant for many years while corporate profits soared until about 1980. Corporate profits collapsed around 1980, in part because of recessionA recession is a significant and sustained decline in the economy. Typically, a recession lasts longer than six months, but recovery from a recession can take a few years. s, but also because of the shift away from the corporate form of business. Over the past 20 years or so, corporate profits have risen and fallen with the business cycle while the overall profits of pass-through businesses have increased steadily.
Figure 2.
Stay informed on the tax policies impacting you.
Subscribe to get insights from our trusted experts delivered straight to your inbox.
Subscribe1986 Also Spelled the Highpoint of the Corporate Form of Business
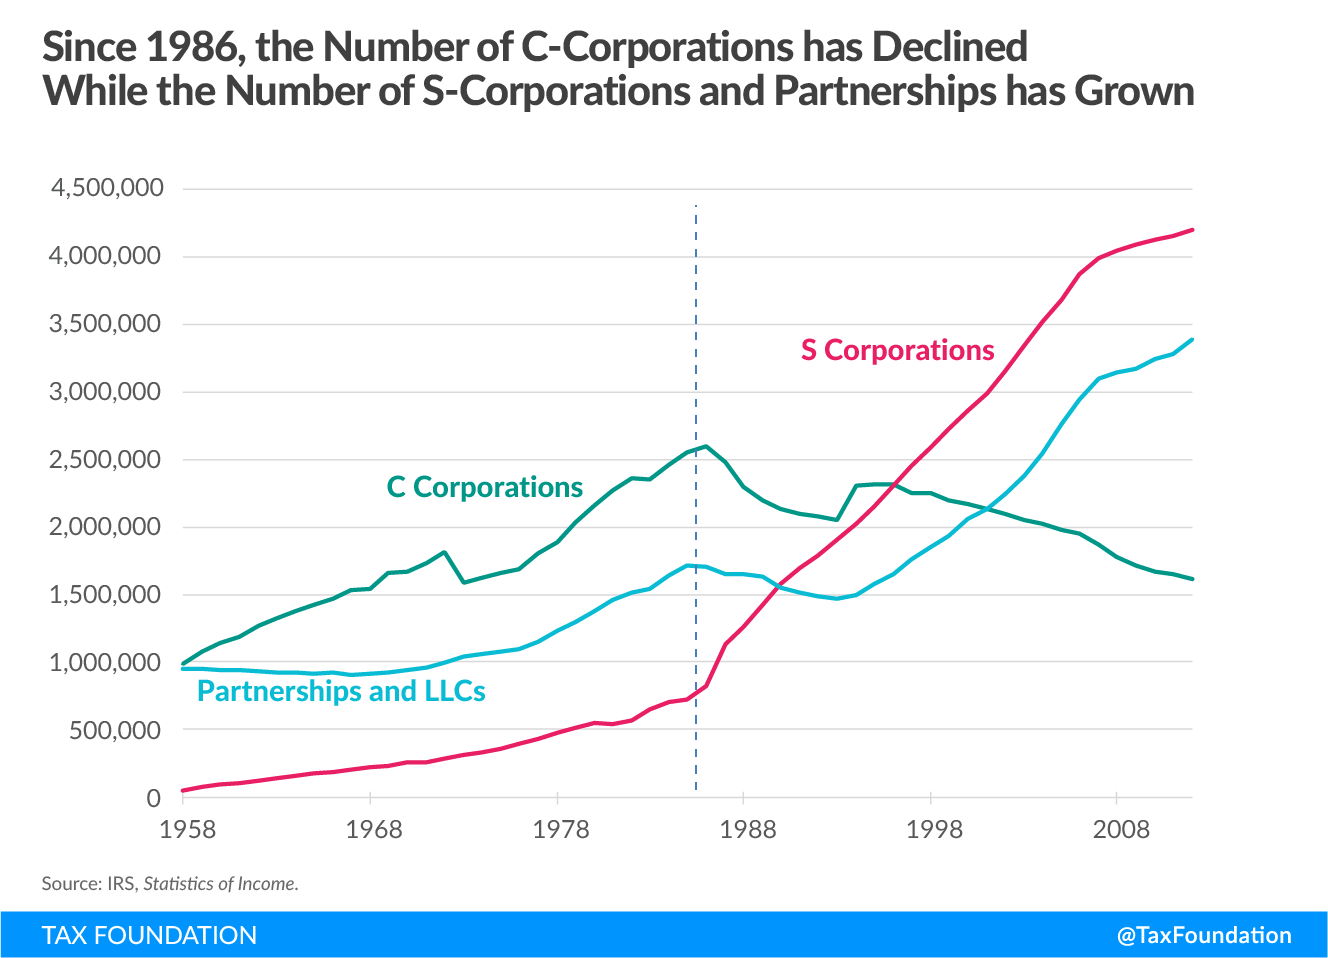
Figure 3illustrates the change in the number of business forms since 1958. It is clear that the fortunes of C corporations, partnerships, and S corporations have changed dramatically over the decades.
In 1958, there were roughly an equal number of C corporations and partnerships, about 1 million each. By contrast, S corporations hardly existed at all. Over the next 20 years, the number of C corporations more than doubled to nearly 2.2 million. The number of partnerships stagnated for many years before gradually growing to about 1.4 million. By 1980, the number of S corporations had grown to about 545,000, still a relatively rare business form in comparison to the others.
The number of C corporations topped out at 2.6 million in 1986. Since then, the number of C corporations has steadily declined, and they now total about 1.6 million, the fewest since 1974.
Meanwhile, the number of pass-through businesses has skyrocketed. Since 1986, the number of S corporations grew by more than five-fold, from about 826,000 to over 4.2 million. The number of partnerships did lag for a few years following 1986, but once the LLC form took off, the number climbed to roughly 3.4 million. This graph does not include sole proprietorships, which grew from 12.4 million in 1986, to over 23 million today.
Figure 3.
Stay informed on the tax policies impacting you.
Subscribe to get insights from our trusted experts delivered straight to your inbox.
SubscribeThe Tax Cuts and Jobs Act May Turn Back Time on Inequality
The Tax Cuts and Jobs Act (TCJA) enacted in 2017 has been criticized by pundits for appearing to benefit corporations and the rich. Independent analysis proves otherwise. In fact, there are elements of the plan that may work in opposite directions to reverse the appearances of rising inequality.
One of the most significant changes in the TCJA was to cut the federal corporate tax rate from 35 percent to 21 percent to make the U.S. more competitive in the global economy. Meanwhile, the TCJA lowered the top individual tax rate from 39.6 percent to 37 percent. In addition, the TCJA created a new 20 percent deduction for certain pass-through business income.
This deduction, called the 199A deduction, lowered the effective rate for successful pass-throughs to 29.6 percent. However, the 21 percent corporate tax rate, combined with the complexity of the 199A deduction has encouraged some very large S corporations and partnerships to change into C corporation form.[4]
Indeed, a study by Penn Wharton predicted that the TCJA would “cause 235,790 U.S. business owners—77 percent of whom have incomes above at least $500,000—to switch from pass-through entity owners to C-corporations, primarily to take advantage of sheltering their income from tax by converting to C-corporations.”[5]
If the TCJA actually leads to more pass-throughs switching to C corporations, we could begin to see more and more business income shift from 1040 individual tax forms to 1120 corporate forms. So while the plan has been criticized for benefiting the rich, the TCJA is leading to a migration of income away from individual tax forms, which could result in the appearance that inequality is shrinking.
Conclusion
Economist Emanuel Saez and Gabriel Zucman point to the 1950s to 1980 era as proof that raising the top income tax rate to 70 percent or higher can reduce inequality and constrain the immoderate and unmerited accumulation of riches. However, Saez’s own data suggests that the high personal income rates of that era simply encouraged the rich to modify the composition of their income and effectively pushed entrepreneurial income out of the income tax system.
During that era, many rich people likely sheltered their income in their businesses, which can retain profits indefinitely, much like an IRA. Their wealth was still there during this period, it was just not accounted for on individual tax returns, which academics rely on to measure inequality.
Those days ended with the enactment of the Reagan tax cuts in 1981 and the tax reform of 1986. As the data presented here has shown, few changes in the tax code over the past 70 years have had as big of an influence on the composition of taxpayer’s income, the composition of business forms, and how business income is taxed as the Tax Reform Act of 1986. It is also clear from the data, that these factors greatly influenced the appearance of rising inequality since then.
The fall and then rise of entrepreneurial income claimed on the wealthy’s 1040 tax returns clearly tracks the seeming decline of inequality from 1950 to 1980, followed by the sudden rise in inequality since 1986. The shifting composition of income claimed by the rich due to changes in tax laws explains this illusion.
Policymakers should not ignore these changes, because it is unlikely that we could tax wealthy taxpayers at the same rates levied 60 years ago without significant economic consequences.
Stay informed on the tax policies impacting you.
Subscribe to get insights from our trusted experts delivered straight to your inbox.
SubscribeNotes
[1] Emmanuel Saez and Gabriel Zucman, “Alexandria Ocasio-Cortez’s Tax Hike Is Not About Soaking the Rich,” The New York Times, January 22, 2019. https://nyti.ms/2ScxWwn
[2] Gerald Auten and David Splinter, “Income Inequality in the United States: Using Tax Data to Measure Long-term Trends,” version November 12, 2017. http://bit.ly/2FVpxrH Piketty and Saez did address some of these issues in a 2018 study. Auten and Splinter revised their report in August 23, 2018 to incorporate those revisions. http://bit.ly/2sRvGwg
[3] This comparison ignores the second layer of tax on corporate income when investors pay tax on dividends or capital gains. An individual owner of a C corporation will also pay two layers of tax, first at the firm level, and then on her salary or the dividend she receives from the firm. However, the owner is free to set her salary to regulate the amount of individual taxes she will pay. C corporations also have the advantage over pass-through businesses in that they can retain earnings, much like an IRA, allowing owner to save through their business until they sell. Capital gains were taxed at half the rate of personal income from the 1950s through the 1970s, and the rate was falling.
[4] Miriam Gottfried, Richard Rubin and Chris Cumming, “KKR to Ditch Partnership Structure and Become Corporation,” Wall Street Journal, May 3, 2018. https://on.wsj.com/2Dxp4JB. See also: IRS Newsroom, “Some S corporations may want to convert to C corporations,” IRS Tax Reform Tax Tip 2018-179, November 20, 2018. https://bit.ly/2HueaZe
[5] Penn Wharton Budget Model, “Projecting the Mass Conversion from Pass-Through Entities to C-Corporations,” June 12, 2018. https://whr.tn/2ReDFxo
Share