The Internal Revenue Service (IRS) has released data on individual income taxes for taxA tax is a mandatory payment or charge collected by local, state, and national governments from individuals or businesses to cover the costs of general government services, goods, and activities. year 2018, showing the number of taxpayers, adjusted gross incomeFor individuals, gross income is the total pre-tax earnings from wages, tips, investments, interest, and other forms of income and is also referred to as “gross pay.” For businesses, gross income is total revenue minus cost of goods sold and is also known as “gross profit” or “gross margin.” , and income tax shares by income percentiles.[1] The new data shows how taxes changed in the first tax year after passage of the Tax Cuts and Jobs Act (TCJA) in December 2017.
The data shows that the U.S. individual income taxAn individual income tax (or personal income tax) is levied on the wages, salaries, investments, or other forms of income an individual or household earns. The U.S. imposes a progressive income tax where rates increase with income. The Federal Income Tax was established in 1913 with the ratification of the 16th Amendment. Though barely 100 years old, individual income taxes are the largest source of tax revenue in the U.S. continued to be progressive, borne primarily by the highest income earners.
- In 2018, 144.3 million taxpayers reported earning $11.6 trillion in adjusted gross income (AGI) and paid $1.5 trillion in individual income taxes.
- Tax year 2018 was the first under the Tax Cuts and Jobs Act (TCJA). The number of returns filed and the amount of income reported grew in 2018 yet average tax rates fell across every income group and total income taxes paid decreased by $65 billion.
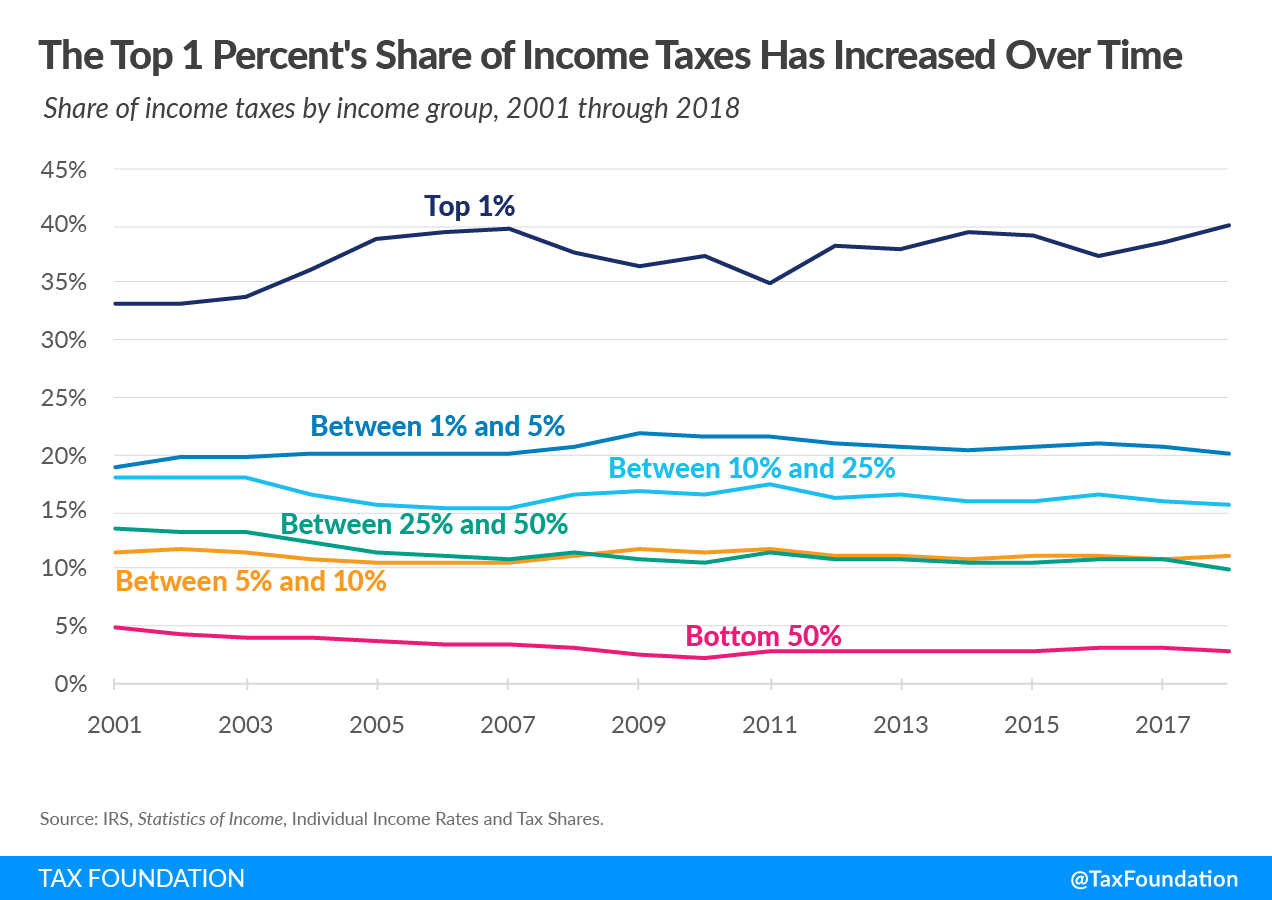
- The share of reported income earned by the top 1 percent of taxpayers fell slightly, to 20.9 percent in 2018 from 21 percent in 2017. Their share of federal individual income taxes rose by 1.6 percentage points to 40.1 percent.
- Since 2001, the share of federal income taxes paid by the top 1 percent increased from 33.2 percent to a new high of 40.1 percent in 2018.
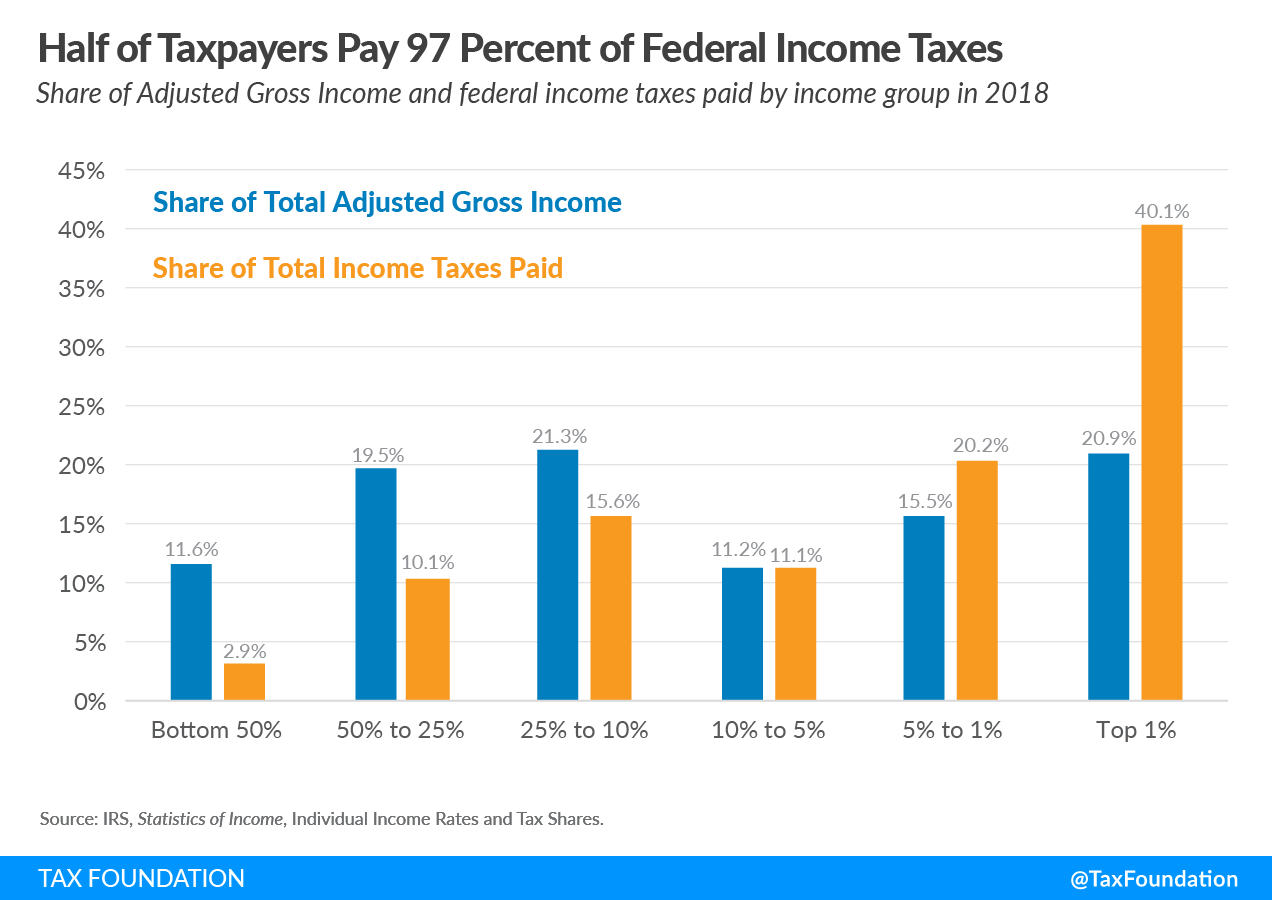
- In 2018, the top 50 percent of all taxpayers paid 97.1 percent of all individual income taxes, while the bottom 50 percent paid the remaining 2.9 percent.
- The top 1 percent paid a greater share of individual income taxes (40.1 percent) than the bottom 90 percent combined (28.6 percent).
- The top 1 percent of taxpayers paid a 25.4 percent average individual income tax rate, which is more than seven times higher than taxpayers in the bottom 50 percent (3.4 percent).
Reported Income Increased While Taxes Paid Decreased in Tax Year 2018
Taxpayers reported $11.6 trillion in adjusted gross income (AGI) on 144.3 million tax returns in 2018, the year the Tax Cuts and Jobs Act (TCJA) took effect. That is just over 1 million more returns filed than in 2017 and $627 billion more in AGI reported than in 2017. Average AGI rose by $3,806, or 5 percent.
While the number of returns and amount of AGI rose, total income taxes paid fell by $65 billion. Altogether, taxpayers paid $1.5 trillion in income taxes in 2018, down about 4 percent from 2017. The average individual income tax rate for all taxpayers fell from 14.6 percent to 13.3 percent.
The share of AGI reported by the top 1 percent fell slightly to 20.9 from 21.0 percent in 2017, while the income tax burden share increased by 1.6 percentage points to 40.1 percent from 38.5 percent in 2017.
| Top 1% | Top 5% | Top 10% | Top 25% | Top 50% | Bottom 50% | All Taxpayers | |
|---|---|---|---|---|---|---|---|
| Number of Returns | 1,443,179 | 7,215,893 | 14,431,787 | 36,079,467 | 72,158,933 | 72,158,933 | 144,317,866 |
| Adjusted Gross Income ($ millions) | $2,420,025 | $4,217,996 | $5,511,117 | $7,969,121 | $10,221,814 | $1,342,069 | $11,563,883 |
| Share of Total Adjusted Gross Income | 20.9% | 36.5% | 47.7% | 68.9% | 88.4% | 11.6% | 100.0% |
| Income Taxes Paid ($ millions) | 615,716 | 926,367 | 1,096,343 | 1,336,041 | 1,491,041 | 45,137 | 1,536,178 |
| Share of Total Income Taxes Paid | 40.1% | 60.3% | 71.4% | 87.0% | 97.1% | 2.9% | 100.0% |
| Income Split Point | 540,009 | 217,913 | 151,935 | 87,044 | 43,614 | 43,614 | |
| Average Tax Rate | 25.4% | 22.0% | 19.9% | 16.8% | 14.6% | 3.4% | 13.3% |
| Average Income Taxes Paid | $426,639 | $128,379 | $75,967 | $37,031 | $20,663 | $626 | $10,644 |
|
Note: Table does not include dependent filers. “Income split point” is the minimum AGI for tax returns to fall into each percentile. Source: IRS, Statistics of Income, Individual Income Rates and Tax Shares. |
|||||||
High-Income Taxpayers Paid the Majority of Federal Income Taxes
In 2018, the bottom 50 percent of taxpayers (those with AGI below $43,614) earned 11.6 percent of total AGI. This group of taxpayers paid $45.1 billion in taxes, or roughly 3 percent of all federal individual income taxes in 2018.
In contrast, the top 1 percent of all taxpayers (taxpayers with AGI of $540,009 and above) earned 20.9 percent of all AGI in 2018 and paid 40.1 percent of all federal income taxes.
In 2018, the top 1 percent of taxpayers accounted for more income taxes paid than the bottom 90 percent combined. The top 1 percent of taxpayers paid roughly $615 billion, or 40.1 percent of all income taxes, while the bottom 90 percent paid about $440 billion, or 28.6 percent of all income taxes.
The share of income taxes paid by the top 1 percent increased from 33.2 percent in 2001 to a high of nearly 40.1 percent in 2018. Over the same period, the share paid by the bottom 50 percent of taxpayers fell from 4.9 percent to just below 3 percent.
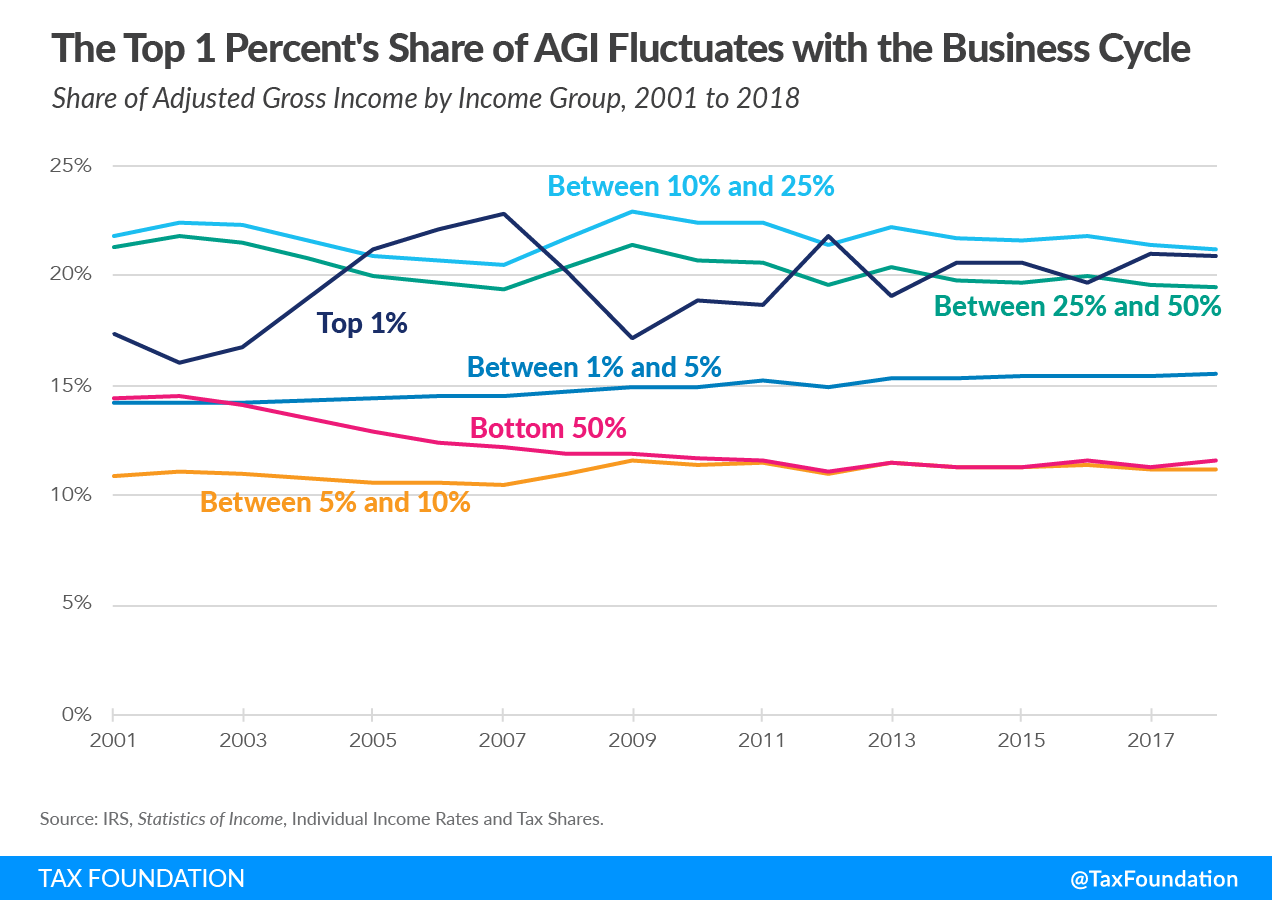
Similarly, the share of adjusted gross income reported by the top 1 percent increased from 17.4 percent in 2001 to 20.9 percent in 2018. It fluctuated considerably over the business cycle, rising with expansions and falling with contractions to a greater extent than income reported by other groups. The share of AGI reported by the bottom 50 percent of taxpayers fell from 14.4 percent in 2001 to 11.6 percent in 2018.
High-Income Taxpayers Paid the Highest Average Income Tax Rates
The 2018 IRS data shows that taxpayers with higher incomes paid much higher average income tax rates than lower-income taxpayers.[2]
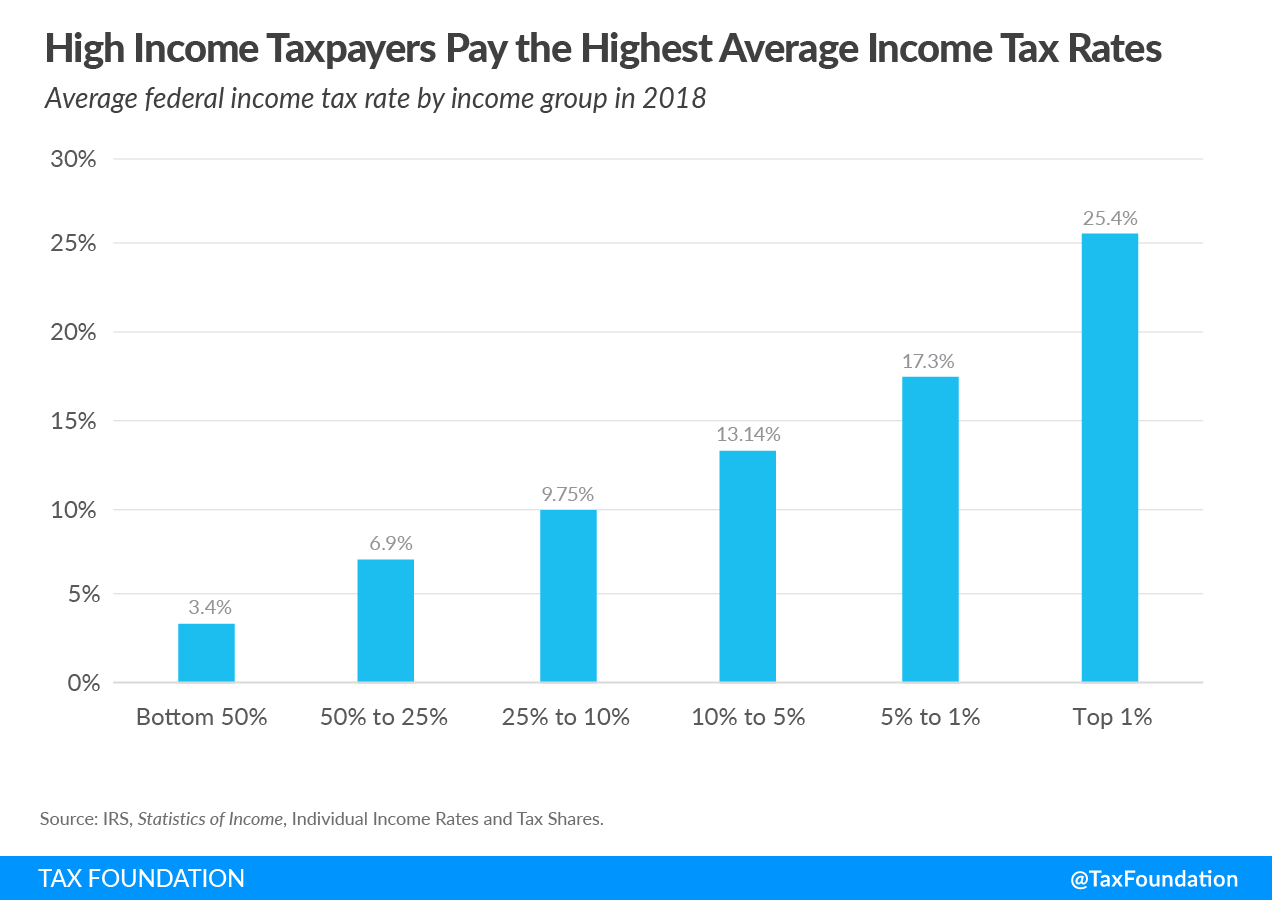
The bottom 50 percent of taxpayers (taxpayers with AGI below $43,614) faced an average income tax rate of 3.4 percent. As household income increases, average income tax rates rise. For example, taxpayers with AGI between the 10th and 5th percentiles ($151,935 and $217,913) paid an average rate of 13.1 percent—almost 4 times the rate paid by those in the bottom 50 percent.
The top 1 percent of taxpayers (AGI of $540,009 and above) paid the highest average tax rateThe average tax rate is the total tax paid divided by taxable income. While marginal tax rates show the amount of tax paid on the next dollar earned, average tax rates show the overall share of income paid in taxes. , 25.4 percent, more than seven times the rate faced by the bottom 50 percent of taxpayers.
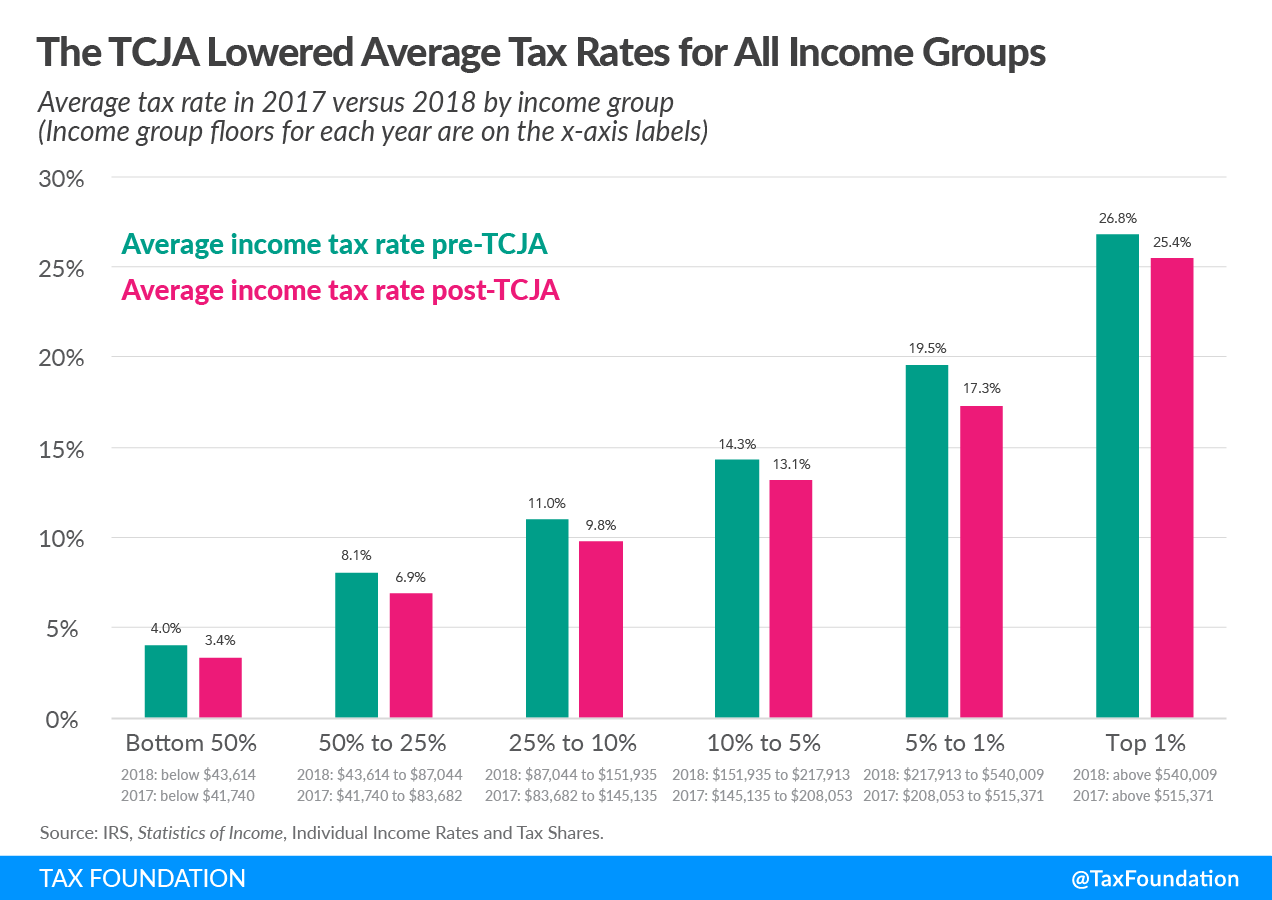
The Tax Cuts and Jobs Act Reduced Average Tax Rates across Income Groups
The 2018 tax year was the first under the Tax Cuts and Jobs Act (TCJA). Due to the TCJA’s changes, average tax rates fell for taxpayers across all income groups. Overall, the average tax rate for all taxpayers fell from 14.6 percent in 2017 to 13.3 percent in 2018. The bottom 50 percent, taxpayers making below $43,614 in AGI in 2018, saw their average tax rate fall from 4.0 percent in 2017 to 3.4 percent in 2018. The top 1 percent, taxpayers making $540,009 and above in AGI in 2018, saw their average tax rate fall from 26.8 percent in 2017 to 25.4 percent in 2018.
You can download the full data set in Excel or PDF form above.
Stay informed on the tax policies impacting you.
Subscribe to get insights from our trusted experts delivered straight to your inbox.
SubscribeAppendix
- For data prior to 2001, all tax returns that have a positive AGI are included, even those that do not have a positive income tax liability. For data from 2001 forward, returns with negative AGI are also included, but dependent returns are excluded.
- Income tax after credits (the measure of “income taxes paid” above) does not account for the refundable portion of the earned income tax creditA tax credit is a provision that reduces a taxpayer’s final tax bill, dollar-for-dollar. A tax credit differs from deductions and exemptions, which reduce taxable income, rather than the taxpayer’s tax bill directly. . If it were included, the tax share of the top income groups would be higher. The refundable portion is classified as a spending program by the Office of Management and Budget (OMB) and therefore is not included by the IRS in these figures.
- The only tax analyzed here is the federal individual income tax, which is responsible for more than 25 percent of the nation’s taxes paid (at all levels of government). Federal income taxes are much more progressive than federal payroll taxA payroll tax is a tax paid on the wages and salaries of employees to finance social insurance programs like Social Security, Medicare, and unemployment insurance. Payroll taxes are social insurance taxes that comprise 24.8 percent of combined federal, state, and local government revenue, the second largest source of that combined tax revenue. es, which are responsible for about 20 percent of all taxes paid (at all levels of government) and are more progressive than most state and local taxes.
- AGI is a fairly narrow income concept and does not include income items like government transfers (except for the portion of Social Security benefits that is taxed), the value of employer-provided health insurance, underreported or unreported income (most notably that of sole proprietors), income derived from municipal bond interest, net imputed rental income, and others.
- The unit of analysis here is the tax return. In the figures prior to 2001, some dependent returns are included. Under other units of analysis (like the U.S. Treasury Department’s Family Economic Unit), dependent returns would likely be paired with parents’ returns.
- The figures represent the legal incidence of the income tax. Most distributional tables (such as those from the Congressional Budget Office, the Tax Policy Center, Citizens for Tax Justice, the Treasury Department, and the Joint Committee on Taxation) assume that the entire economic incidence of personal income taxes falls on the income earner.
[1] Internal Revenue Service, Statistics of Income, “Number of Returns, Shares of AGI and Total Income Tax, AGI Floor on Percentiles in Current and Constant Dollars, and Average Tax Rates,” Table 1, and “Number of Returns, Shares of AGI and Total Income Tax, and Average Tax Rates,” Table 2, https://www.irs.gov/statistics/soi-tax-stats-individual-income-tax-rates-and-tax-shares.
[2] “Average income tax rate” is defined here as income taxes paid divided by adjusted gross income.
Share