Key Findings
- Gross receipts taxes fall short of many characteristics of sound taxA tax is a mandatory payment or charge collected by local, state, and national governments from individuals or businesses to cover the costs of general government services, goods, and activities. policy: they lack economic efficiency, treat firms differently based on their structure, and are problematically nontransparent.
- Though there are few recent empirical studies on gross receipts taxes because of their near-universal abandonment in developed countries, some literature on taxes with similar structures can shed light on economic effects of gross receipts taxes.
- Gross receipts taxes and other taxes levied on business inputs have been shown to result in “forward shifting” of costs on to final consumers. Smart and Bird (2009) find significant forward shifting of taxes on business inputs in Canada’s sales taxA sales tax is levied on retail sales of goods and services and, ideally, should apply to all final consumption with few exemptions. Many governments exempt goods like groceries; base broadening, such as including groceries, could keep rates lower. A sales tax should exempt business-to-business transactions which, when taxed, cause tax pyramiding. system, which was abandoned by four of nine provinces between 1992-1997.
- Though gross receipts taxes are business taxes and as such are sometimes viewed as progressive, in reality, they have potential to be more regressive than sales taxes as they pyramid and are passed on to consumers.
- Despite concerns that value-added-taxes (VATs) were replacing a more progressive system of gross receipts taxes, Alavuotunki and Pirttila (2015) find that countries saw no significant movement on measures of inequality between 1975 and 2010. An impact on the GINI index would have been expected if eliminating taxes on business-to-business purchases had a progressive incidence.
- Recent studies by Ufier (2014) and Adhikari (2015) link the abandonment of gross receipts taxes with increased production efficiency and growth in GDP per capita.
Introduction
A gross receipts taxGross receipts taxes are applied to a company’s gross sales, without deductions for a firm’s business expenses, like compensation, costs of goods sold, and overhead costs. Unlike a sales tax, a gross receipts tax is assessed on businesses and applies to transactions at every stage of the production process, leading to tax pyramiding. is levied against the receipts of a sale that results in a change of ownership. Gross receipts taxes are largely a historical novelty to the developed world because most evaluations of tax instruments emphasize traits the gross receipts taxes perform relatively badly on: economic efficiency, equity, and transparency.[1] By including transactions at intermediate stages of production, these “turnover taxes” are not based on profits, measures of income, or any other indicator of consumption power that is targeted by most other tax instruments in modern developed economies. Furthermore, the tax gives a competitive advantage to bigger businesses that can make their own inputs rather than buy them. Finally, as taxes get added to the various stages of production they “pyramid” into the final price, so that the effective tax rate on goods exceeds the tax rates presented to voters and final consumers.
In the United States, most of the gross receipts tax adoptions were spurred by the fiscal pressures of the Great Depression of the 1930s.[2] Even by World War II, however, many gross receipts taxes were found to be unconstitutional or were otherwise repealed, with only four states (Indiana, West Virginia, Washington, and Delaware) retaining theirs into the 1980s.[3] States that repealed the taxes generally substituted the revenues with greater dependence on business income and retail sales taxes. The path was similar in Europe, where gross receipts tax-style turnover taxes were among the major classes of taxes to be replaced by the value-added tax in the 1960s and 1970s.
This article highlights the logic of why such widespread and seemingly coordinated abandonment of the gross receipts taxes occurred. It also reviews the empirical evidence of this effort and concludes that history has favorably rewarded this abandonment. Finally, the essay reviews the arguments where cases supporting the gross receipts taxes would arise, which itself demonstrates that the gross receipts taxes should remain an instrument of the pre-WWII era for the United States.
Illustrating the Case against Gross Receipts Taxes
Most are familiar with the convention among economists to emphasize taxes that limit “distortions” or avoid “inefficiency.” What this really means is that tax instruments should avoid playing favorites in the marketplace, and this is where the gross receipts tax proves to be unusually disappointing.
One of the most significant decisions facing an entrepreneur is whether to buy their inputs or “make” them by taking on a larger portion of the production-to-household process. Inevitably, they are likely to buy some inputs and make others, but the gross receipts tax provides a competitive advantage to the firms which own the largest share of the pre-final sale process—the most vertically integrated.[4]
To illustrate this, let’s consider the case of soap. Major retailers and big box stores often sell their own brand in addition to other brands of soap to households, which represent the “final sale” in the process. Households can also find other local or name brands at these stores or other retailers. The manufacture of soap requires many specialized inputs, ingredients such as lye and essential oils, as well as packaging. If any of these inputs are acquired through exchange rather than in-house production, then these exchanges will have the gross receipts tax applied to their sale. After the soap is manufactured it can be retailed directly to households. Again, if the ownership of the manufacturing differs from the ownership of the retailer, then this exchange is also subject to the gross receipts tax. The final exchange from retailer to the household is taxed again. A brand with fewer of these intermediate exchanges can create an advantage through the tax code under the gross receipts tax.
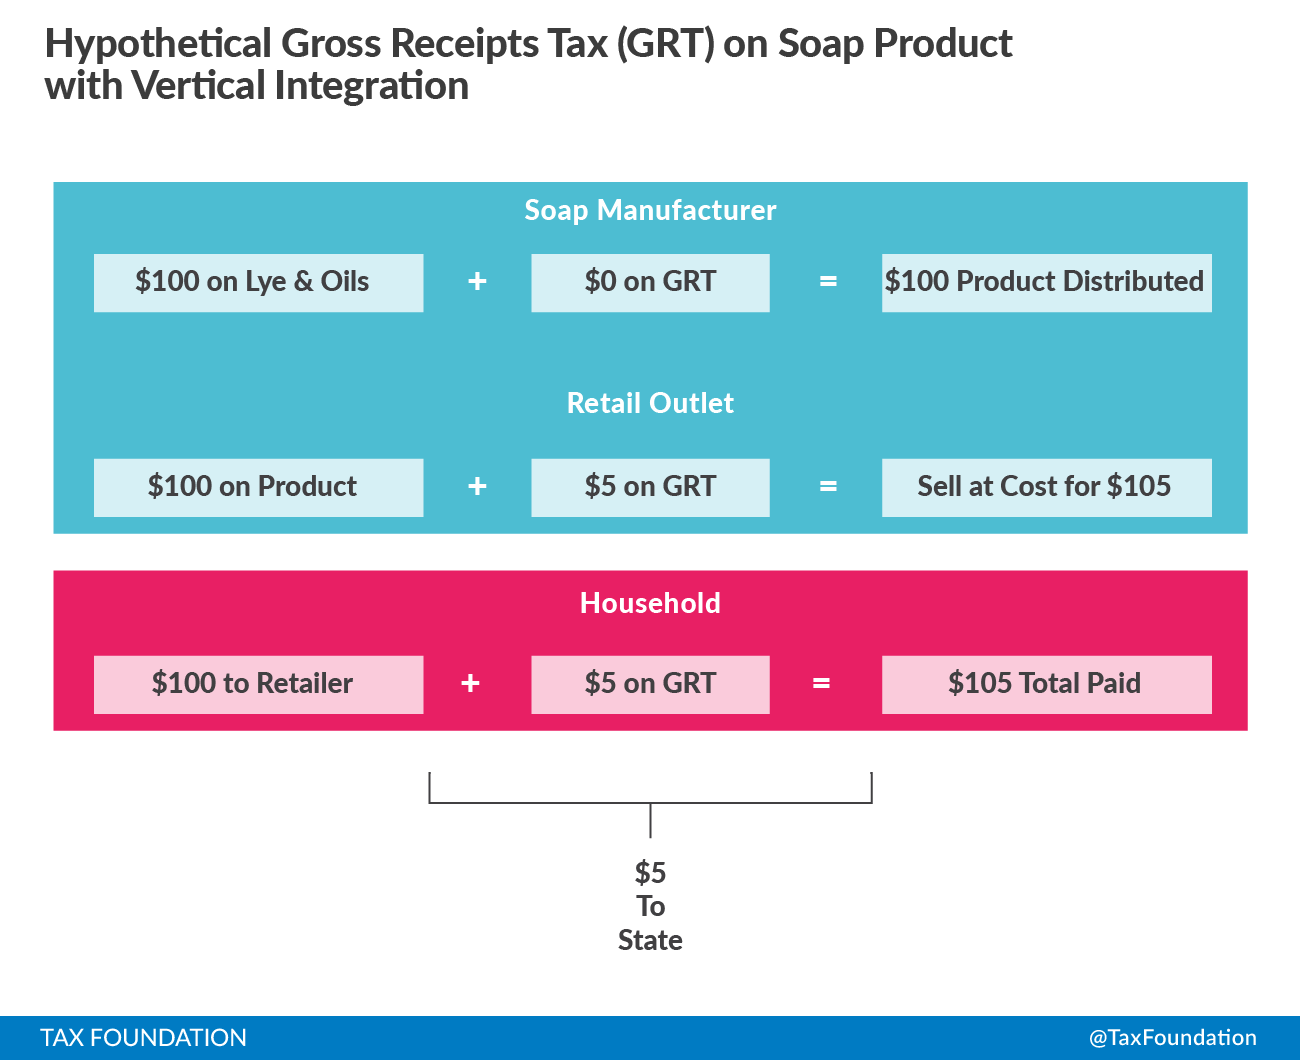
Figure 1 serves to illustrate the gross receipts tax in the simplest possible formulation, where a gross receipts tax of 5 percent is applied to a soap maker who buys the ingredients for $100 plus taxes and sells it to a retailer for final sale. For simplicity, the example in Figure 1 will assume that the soap manufacturer sells at the tax-inclusive cost of $105 for no profit, and that the retailer sells at their tax-inclusive cost for no profit. The amount of the taxes increases at each stage, because the sale price includes all the taxes of all previous stages. Combining the tax on the manufacturer, retailer, and consumer means that the 5 percent gross receipts tax rate on a $100 product to the economy is effectively taxed at a rate of 15.76 percent in this example. To contrast, Figure 2 illustrates the case where the gross receipts tax is applied to a firm producing an identical soap but also owns all the previous stages of production, similar to the store brands in big box retailers. This firm avoids the ownership exchanges that create the statutory obligation to apply the tax until the final sale. For this $100 product there is only $5 in tax obligation, which is more than $10 less than the case presented in Figure 1. From this, it is clear why a larger firm that owns its input suppliers or with the capability to expand its scope to include input production would favor the gross receipts tax, as those competitors less capable of this integration are faced with a significant disadvantage. In the illustrative case, under the gross receipts tax, the larger, vertically-integrated firm of Figure 2 had a tax rate of 5 percent, while the gross receipts tax compounded into an effective tax rate of more than 15 percent.
Figure 1.
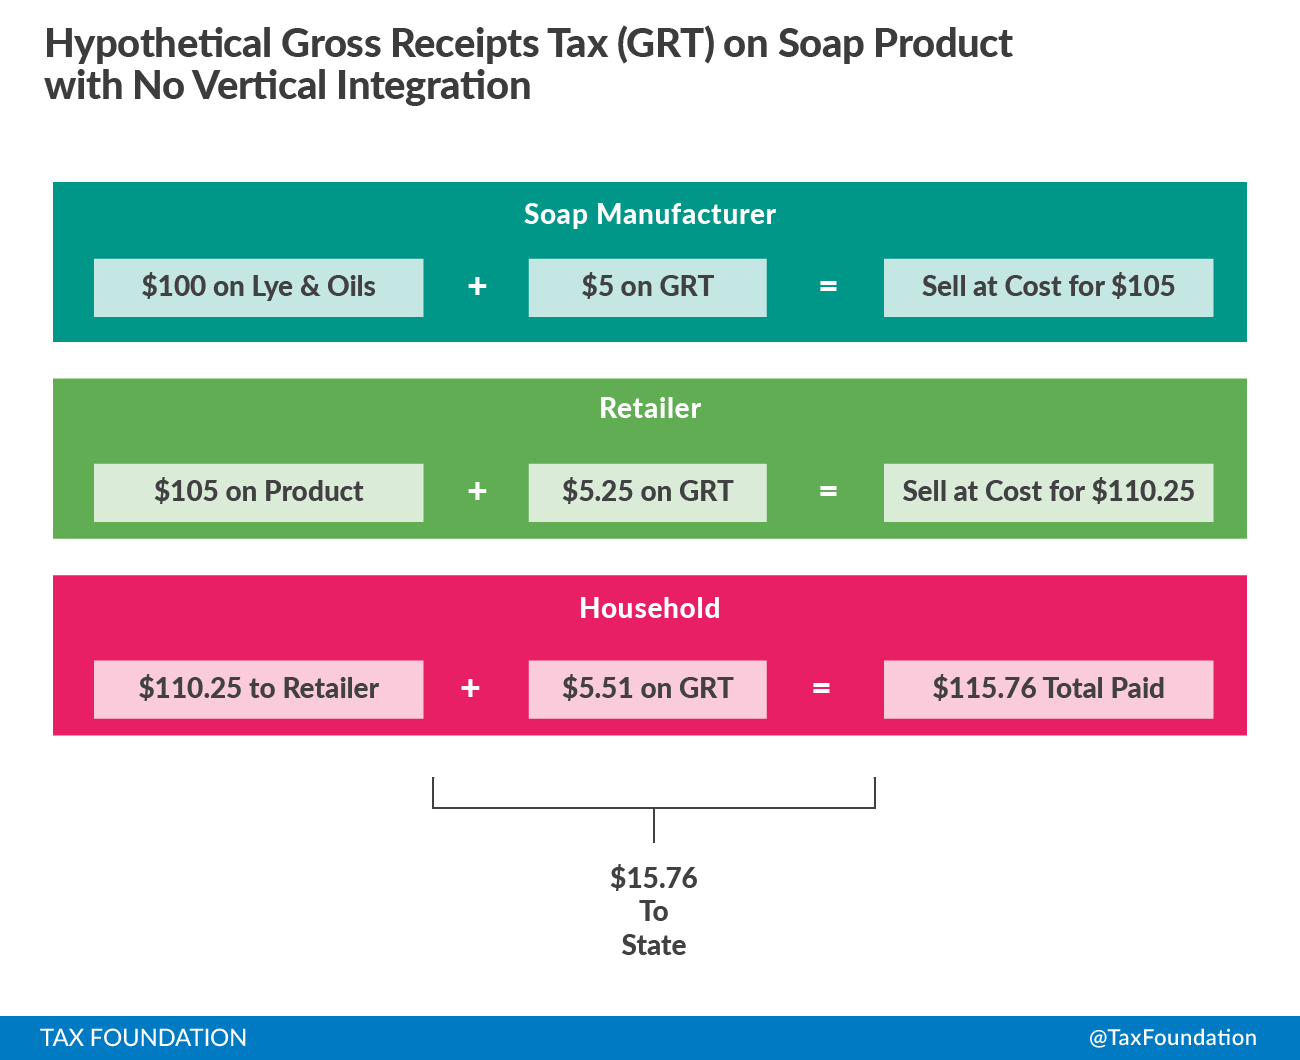
Figure 2.
Economic growth is at some level tied to the concept of economic efficiency, the ability to best satisfy consumer preferences with the least amount of input. Competition among market actors encourages economic efficiency by incentivizing experimentation with both product delivery and with organizational structure. Big box retailers directly compete with many small, specialized retailers with different store designs, mixes of brands, shipping logistics, and countless other decisions. Ideally, the tax code should avoid becoming another one of those considerations, remaining neutral in the competitive process, and not encouraging reorganization or altering of an organization’s structure to yield a tax advantage.
Beyond the efficiency and equity of the policy, gross receipts taxes are also heavily criticized for their lack of transparency. The 5 percent gross receipts tax in Figure 1 raised $15.76 in revenue on $100 of economic product, an effective tax rate of 15.76 percent. To use an economically neutral tax that yielded an equivalent amount of revenue for this case would be to levy 15.76 percent tax on final sales only. It is not difficult to surmise the political appeal of headlines reporting a proposed 5 percent rate instead of 15.76 percent, but it is fiction to use the former rate as being representative of the cost of government relative to the size of the economy. The idea that voters might tolerate the collection of $15 in tax revenue with a tax rate of 5 percent that they would reject if they realized the tax rate was actually 15 percent is a violation of transparency.
These perspectives inform the prima facie case against the gross receipts tax under most circumstances from economists and policy experts. The competitive advantages it can bestow to less efficient but larger firms with greater production scope is damaging to economic performance. The tax also performs poorly in terms of providing transparency in representing the cost of government. These and other concerns raised in empirical investigations are the subject of the next section.
Recent Evidence on Gross Receipts Taxes
There are relatively few studies where the gross receipts tax is the direct subject of interest. The prima facie case against the taxes is so strong, and they have been abandoned by so much of the world for such a long time, that it is difficult for a scholar to devote attention to it and be rewarded with a reputation for establishing a relevant and interesting research agenda. However, there is academic research on tax features that are directly relevant to gross receipts taxes. In particular, this research tends to focus on effects of taxes on business-to-business purchases, which is the main feature of a gross receipts tax.
The difference between the gross receipts taxes and other taxes, particularly the retail sales tax, exists on a spectrum. The primary distinction between retail sales taxes and the gross receipts taxes is that sales taxes are intended to exclude business-to-business transactions, yet it has been estimated that through flaws in tax structure, about 40 percent of the expenditures subjected to the retail sales tax are business purchases.[5]
As a result, some prescient lessons about gross receipts taxes come from studies of retail sales taxes and particularly value-added taxes, which replaced the turnover tax in most of the world. As Bird and Smart (2008) note,
The conventional wisdom among public finance economists is that value-added taxes are superior to either retail sales taxes or gross receipts taxes that raise the same revenue…Both RSTs [retail sales taxes] and gross receipts taxes tend to cascade through the value-added chain, which distorts the relative prices of business inputs, particularly capital goods.
The gross receipts tax relevant implications of these studies are reviewed here.
Evidence on Pyramiding
In the illustration of Figure 1, the taxes paid at each turnover point are “shifted forward” into the sale price of each good: the $5 tax paid by the producer is added into the tax baseThe tax base is the total amount of income, property, assets, consumption, transactions, or other economic activity subject to taxation by a tax authority. A narrow tax base is non-neutral and inefficient. A broad tax base reduces tax administration costs and allows more revenue to be raised at lower rates. for the retailer, and again into the tax base for the household. This is known as tax pyramidingTax pyramiding occurs when the same final good or service is taxed multiple times along the production process. This yields vastly different effective tax rates depending on the length of the supply chain and disproportionately harms low-margin firms. Gross receipts taxes are a prime example of tax pyramiding in action., and the illustration employed here assumes 100 percent forward shifting. Unfortunately, providing evidence on shifting is difficult for any single stage, and evidence on following every stage is exponentially more challenging due to the complexities of tax codes throughout the production process, the literally changing nature of the product (e.g., a pencil begins as a tree), the number of turnover stages in the production of a particular good, and the different data requirements needed. For example, an empirical analysis by Besley and Rosen (2009) of the relationship between sales taxes and prices for a set of commodities in 155 American cities found the price to rise by the amount of the tax applied at the retailer-to-household level for half of their commodities, while the other commodities revealed that increases in these tax rates resulted in price increases greater than the retail-to-household tax.[6] The authors acknowledge that the result is consistent with tax pyramiding from the taxes being applied to business-to-business sales, but they could not definitively rule out competing explanations for the finding because they did not have data on the extent to which the inputs were purchased in different markets.
This limitation was overcome by Smart and Bird (2009) in a clever study of Canadian provinces.[7] Much like the American states, Canadian provinces in the early 1990s levied retail sales taxes that included business-to-business transactions to a substantial degree. In fact, the authors estimated that 43 percent of the provincial retail sales tax revenues came from taxing business inputs. In a series of tax reforms between 1992 and 1997, four of the nine provinces with retail sales tax reformed to instead employ an invoice-and-credit VAT, which substantially diminished the application of the tax on business-to-business transactions. Using an input-output model, Smart and Bird were able to calculate the resulting “tax shock” from the production chain in each province from the reforms across different commodities (e.g., food, clothing, transportation, etc.) and the impact of the reform on effective tax rates from 1992 to 2005 in each province. This design allowed the authors to estimate a “pass through elasticity” on the degree to which taxes are pyramiding through onto consumers. While the results differ across subcategories of expenditures, the overall estimated effect is that pass through was 100 percent. Among the subcategories, seven of the eight categories found some degree of forward shifting, and five of them reported at least full forward shifting.
Evidence on Economic Efficiency and Growth
As described earlier, the consequences of tax pyramiding make the gross receipts tax a more economically damaging means of raising public revenue than other comparable tax instruments because of its effects on competition and resource use. An important challenge to performing good research on this question is that gross receipts tax and turnover taxes can be enforced with rudimentary tax administration systems, which introduces the possibility that economic growth itself induces more sophisticated tax systems that allow countries and states to give up a gross receipts tax. In other words, it is possible for economic growth to cause gross receipts tax abandonment, which would lead to the research overstating the effect of gross receipts tax abandonment on economic growth. Research addressing this concern is an important mark of quality evidence.
Ufier (2014) provides such evidence. Like the previously discussed study of Canada, this study examines national tax reforms into the VAT.[8] However, in this case Ufier (2014) is tracking 192 countries between 1965 and 2010, with the main cases of VAT adoption coming from Europe and South America in the 1970s and former Soviet countries in the early 2000s as they sought to displace their own product turnover taxes.[9]
Importantly, this paper pays careful attention to the initial decision to reform into the VAT by modeling the decision to adopt. This stage of the design allows the formulation of a probability that the VAT would be adopted in each country-year. Countries can then be matched to a counterpart that was similarly inclined to adopt the VAT but that did not adopt. Ufier finds that there is an increase in GDP per capita growth of 2.17 percent in the adoption year and just under 2 percent up to four years after adoption. Price inflation is also found to decline, which may be a byproduct of diminished tax pyramiding, but nothing in the study design can definitely make that link. Similarly, government consumption as a share of GDP also declines, which may be a consequence of moving to a more transparent tax system, but again the study is not designed to rule out competing explanations to transparency.
A similar attempt at this research question is performed by Adhikari (2015), again following countries over time that reform into the VAT design.[10] The innovation of this study in terms of its research credibility is the implementation of the relatively new synthetic control method (SCM).[11] The SCM works through taking a set of countries that never adopt a VAT, but can be combined through a data-driven process that is nearly identical to the reform countries during the period prior to their reform. In theory, if the reforms have no effect on the tracked outcomes, then these “synthetic” countries will continue to predict the adopting countries in the post-reform period. Among high and upper-middle income countries, the analysis finds that GDP per worker is 10 to 11 percent higher after the reform five to 10 years after the reform.[12] For upper-middle income countries’ GDP per worker, the effects are 25.5 percent after five years and 33.1 percent after 10 years. The study digs further into the underlying mechanisms in capital stock and total factor productivity and finds the same significant patterns, suggesting that this GDP growth is driven by enhancements in production efficiency. The Adhikari study finds no effects of any of these variables in the low-middle or low income countries (e.g., Honduras, Columbia, Senegal, etc.), and is a finding that will be discussed in the next section.
Evidence on Inequality
It is difficult to distill a single perspective on the gross receipts tax in terms of its effects on inequality, and there is no clear theoretical expectation. By taxing intermediate business-to-business inputs, the gross receipts tax is sometimes viewed as a business tax and is therefore progressive. Of course, as these taxes are pyramided into the final household price, then households that consume a large percent of their income will bear more of the burden and the gross receipts tax will be an even more regressive version of a sales tax.
As far as equity between businesses is concerned, two firms with the same receipts but different net incomes would face the same gross receipts tax bill, effectively taxing low-margin firms more heavily than high-margin firm. Finally, the gross receipts tax likely has different effects on different industries depending on how long their production chain of turnover is, and it is unknown how (if at all) turnover frequency relates to household consumption of goods.
The only major study of the topic is found in Alavuotunki and Pirttila (2015), which once again is examining VAT adoption across countries from 1975 to 2010.[13] The outcome of interest is income inequality measured by the GINI index. To treat the potential problem of reverse causality, which would arise if countries targeting progressive reforms also adopted VATs, they employ a technique that estimates the effect arising from countries that were induced into VAT by neighboring countries’ VAT adoptions. The authors find no statistically significant effect on GINI inequality.
Arguments for Gross Receipts Taxes
There are limited circumstances where economic theory provides a defense of the use of the gross receipts tax, but these cases seem unlikely to apply to the American states. The clearest argument is a situation where tax administration is so weak that evasion is rampant or otherwise exists in an informal sector that is difficult for tax authorities to observe, and the alternative policies considered are either tax on profits or product turnover (i.e., gross receipts tax).
This situation assumes that it will be substantively easier for these authorities to observe product turnover than firm profit, and that the tax rate on turnover will be much lower as a result. Such circumstances imply that evasion or avoidance will result in a tax on profits generating large “kinks” where the marginal tax rate effectively experiences a large jump, while a turnover tax would remain low, smooth, and continuous relative to resource use. As a result, the distortion effects of product turnover taxes are small relative to the distortions related to hiding income.
Economists have considered such arguments for minimum tax schemes as supplements to profit taxes that exist in numerous developing countries (e.g., Argentina, Bolivia, Ivory Coast, Panama, Senegal, etc.), and there is recent evidence to support it. For instance, in a study of corporate tax returns in Pakistan between 2006 and 2010, where these tax schemes are employed, Best et al. (2015) discovered that the predicted bunching expected under this theory does appear.[14] This theory is also consistent with Adhikari’s (2015) finding that low income countries experienced no gains from reforming to the VAT. However, tax administration across the United States is not lacking in a such a way to make this situation comparable.
A second argument for the gross receipts tax is that it might offer advantages over a poorly structured alternative tax instrument. For instance, as already covered, many states include a great deal of the business-to-business purchases in their retail sales taxes. At the same time, many states substantially ignore a considerable portion of the service sector. While the gross receipt tax is just as capable of ignoring the service sector as the retail sales tax, a deliberate expansion of business-to-business purchases might create a de facto tax on these services, which might reduce some of the distortions in consumer choices between goods and services. Service providers like rental property agencies, lawyers, and accounting agencies might be untaxed on their services to households, but a gross receipts tax would create a de facto final tax by catching their inputs. There is no empirical evidence to this kind of idea, but economic theory at least would seem to illustrate that the conditions could exist. It is likely, however, that the correlation between product turnover on inputs is only weakly correlated with many services. It is also a bit of an ad hoc defense as it is always the case that once you eliminate all the better ideas, whatever remains no matter how bad must be the best idea. It is difficult to reconcile that with the broader goals of a tax reform.
Conclusions
This examination of the theory and evidence in economic research creates a powerful case against the gross receipts tax. The structure of gross receipts taxes creates an uneven playing field among competitive producers of similar goods. Specifically, the tax favors firms that own a larger share of the production process.
Secondly, gross receipts taxes also favor firms with higher net incomes relative to their receipts, a circumstance more likely for established firms than new entrants. The tax also is appealing to policymakers who wish to underrepresent the cost of government by spreading the tax across the product chain. These combined distortions weaken the economy’s potential for growth. There exists careful empirical work that finds support for these concerns.
The evidence and theory also explain the history of gross receipts tax use in most of the world. When economies are largely informal or unobservable by the existing tax authorities, the gross receipts tax might offer fewer distortions than a profits tax. Most American states quickly adopted the tax during the Great Depression, and abandoned it quickly thereafter. European countries made abandonment of product turnover taxes a requirement for joining their economic union, and developing and low income countries today continue to employ it. Countries aspire through reform to avoid resorting to gross receipts taxes because of their hindrance to growth and development. Moving in the opposite direction should not be a goal of tax reform within the United States.
Taxes make more sense with us in your inbox.
Subscribe to our newsletter for tax insights that cut through the noise—and make sense of it.
Sign Up[1] Mikesell, John L., “Gross Receipts Taxes in State Government Finances: A Review of Their History and Performance,” Tax Foundation Background Paper Number 53, January 2007.
[2] Kaeding, Nicole and Erica Wilt, “Gross Receipts Taxes: Lessons from Previous State Experiences,” Tax Foundation Fiscal Fact No. 523, August 2016.
[3] Mikesell, 5-6.
[4] A more extensive elaboration on this point is found in Chamberlain, Andrew and Patrick Fleenor, “Tax Pyramiding: The Economic Consequences of Gross Receipts Taxes,” Tax Foundation Special Report No. 147, December 2006.
[5] Ring, Raymond J., Jr., “The Proportion of Consumers’ and Producers’ Goods in the General Sales Tax,” National Tax Journal, Vol. 42, No. 2, 167-79; Mikesell, John L., “Misconceptions about Value-Added and Retail Sales Taxes: Are They Barriers to Sensible Tax Policy?” Public Budgeting & Finance, Vol. 34, No. 2, 1-23.
[6] Besley, Timothy J. and Harvey S. Rosen, “Sales Taxes and Prices: An Empirical Analysis,” National Tax Journal, Vol. 52, No. 2, 1999, 157-78.
[7] Smart, Michael and Richard M. Bird, “The Economic Incidence of Replacing a Retail Sales Tax with a Value-Added Tax: Evidence from Canadian Experience,” Canadian Public Policy, XXXV, No 1, 2009, 85-97.
[8] Ufier, Alex, “Quasi-Experimental Analysis on the Effects of Adoption of a Value Added Tax,” Economic Inquiry, Vol. 52, No. 4, 2014, 1364-79.
[9] For further discussion of this point, see Ebrill, Liam, Michael Keen, Jean-Paul Bodin, and Victoria Summers, “The Allure of the Value-Added Tax,” Finance & Development, Vol. 39, No. 2, 2002.
[10] Adhikari, Bibek, “When Does Introducing a Value-Added Tax Increase Economic Efficiency? Evidence from the Synthetic Control Method,” Tulane University Department of Economics Working Paper Series, November 2015.
[11] The synthetic control method was first presented in Abadie, Alberto, and Javier Gardeazabal, “The Economic Costs of Conflict: A Case Study of the Basque Country,” American Economic Review, Vol. 93, No. 1, 2003, 113-32.
[12] High income countries in the study include: Austria, Belgium, Canada, Denmark, France, Greece, Italy, Japan, Netherlands, New Zealand, Spain, Sweden, and the United Kingdom. Upper-middle income countries include Argentina, Chile, Ireland, Mauritius, Panama, Portugal. Lower-middle and lower income countries include Columbia, Costa Rica, Dominican Republic, Honduras, Jamaica, Peru, Senegal, Thailand, Uruguay, Bangladesh, Guinea, Kenya, Nepal, and Pakistan.
[13] Alavuotunki, Kaisa and Jukka Pirtilla, “The Consequences of the Value-Added Tax on Inequality,” United Nations University World Institute for Development Economics Research Paper 2015/111, 2015.
[14] Best, Michael Carlos, Anne Brockmeyer, Henrik Jacobsen Kleven, Johannes Spinnewijn, and Mazhar Waseem, “Production versus Revenue Efficiency with Limited Tax capacity: Theory and Evidence from Pakistan,” Journal of Political Economy, Vol. 123, No. 6, 2015, 1311-55.
