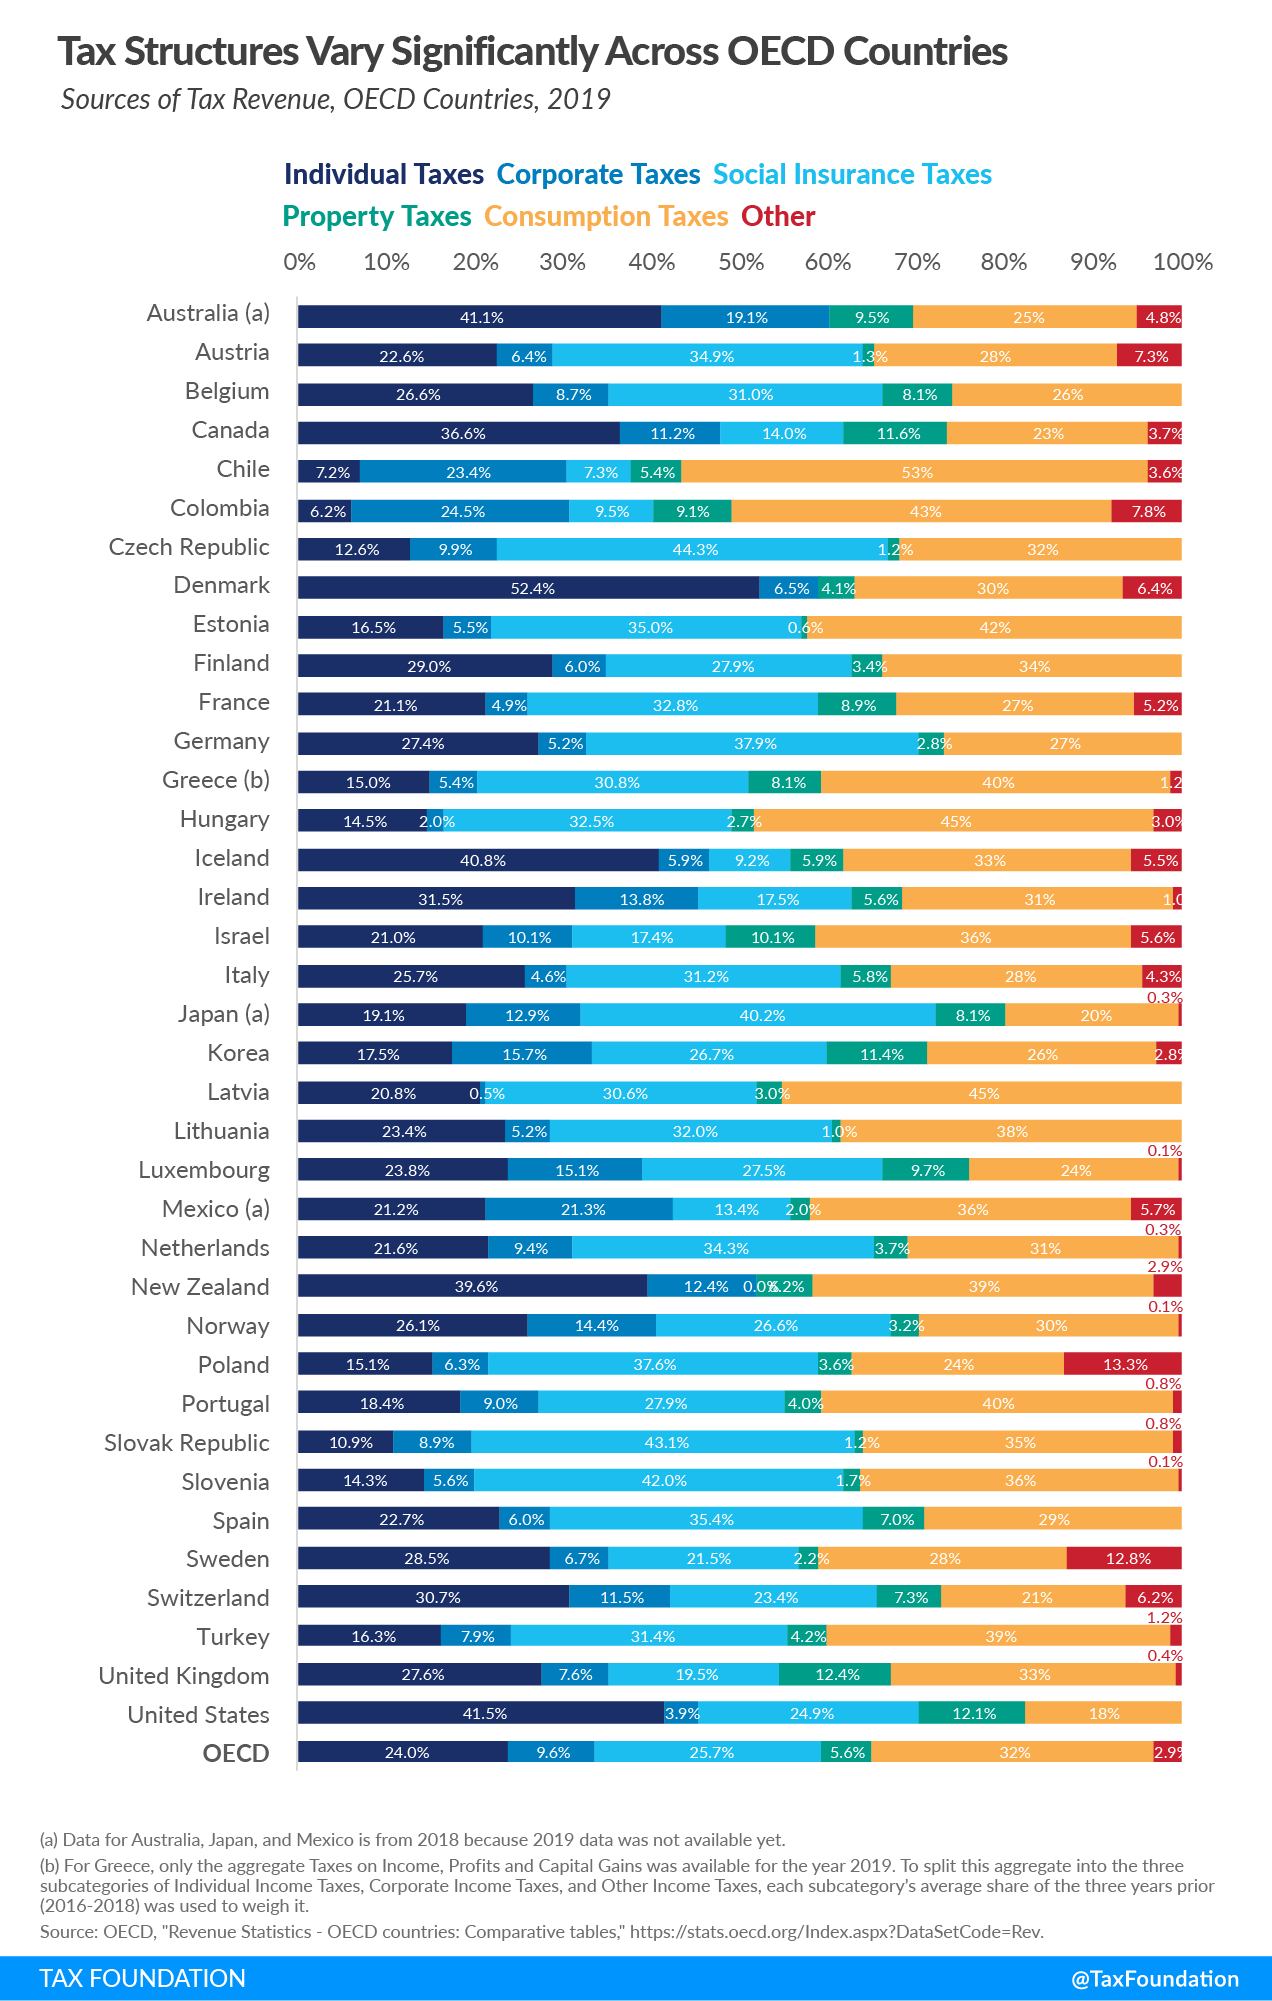
Developed countries raise taxA tax is a mandatory payment or charge collected by local, state, and national governments from individuals or businesses to cover the costs of general government services, goods, and activities. revenue through individual income taxes, corporate income taxes, social insurance taxes, taxes on goods and services, and property taxes—the combination of which determines how distortionary or neutral a tax system is. For example, taxes on income can do more economic harm than taxes on consumption and property. Countries across the Organisation for Economic Co-operation and Development (OECD) differ substantially in how they raise tax revenue.
A country may decide to have a lower corporate income taxA corporate income tax (CIT) is levied by federal and state governments on business profits. Many companies are not subject to the CIT because they are taxed as pass-through businesses, with income reportable under the individual income tax. to attract investment, which can reduce its reliance on corporate income tax revenue and may instead decide to raise a larger share of its revenue through broad-based and relatively flat taxes like social insurance and consumption taxes. Often, those revenue sources are less volatile and less harmful to decisions to work and invest.
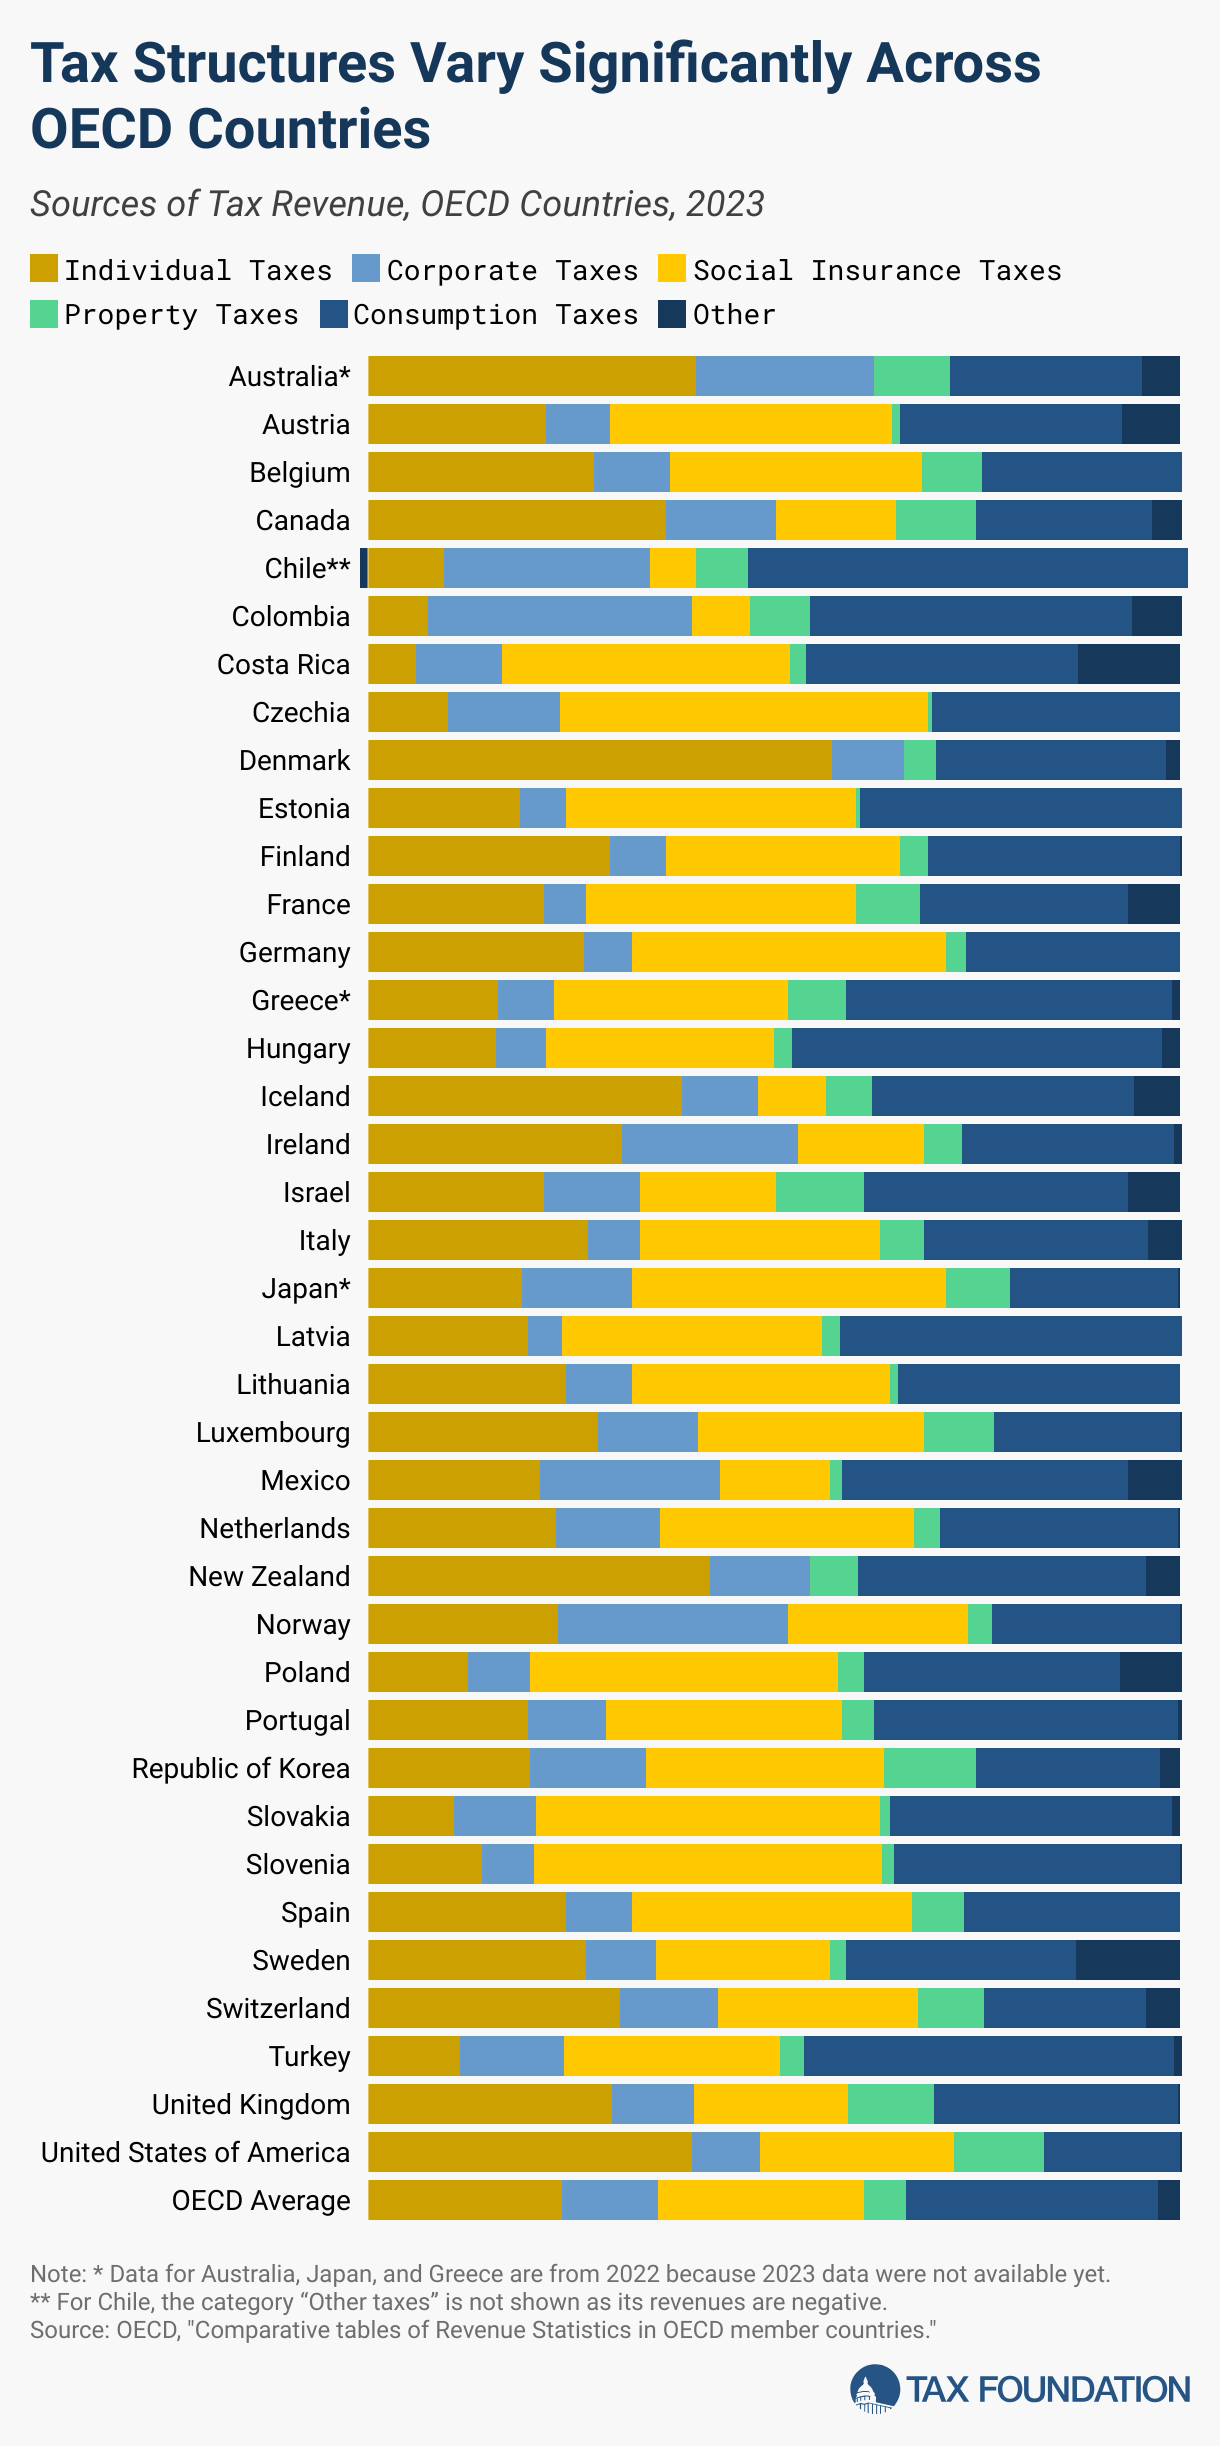
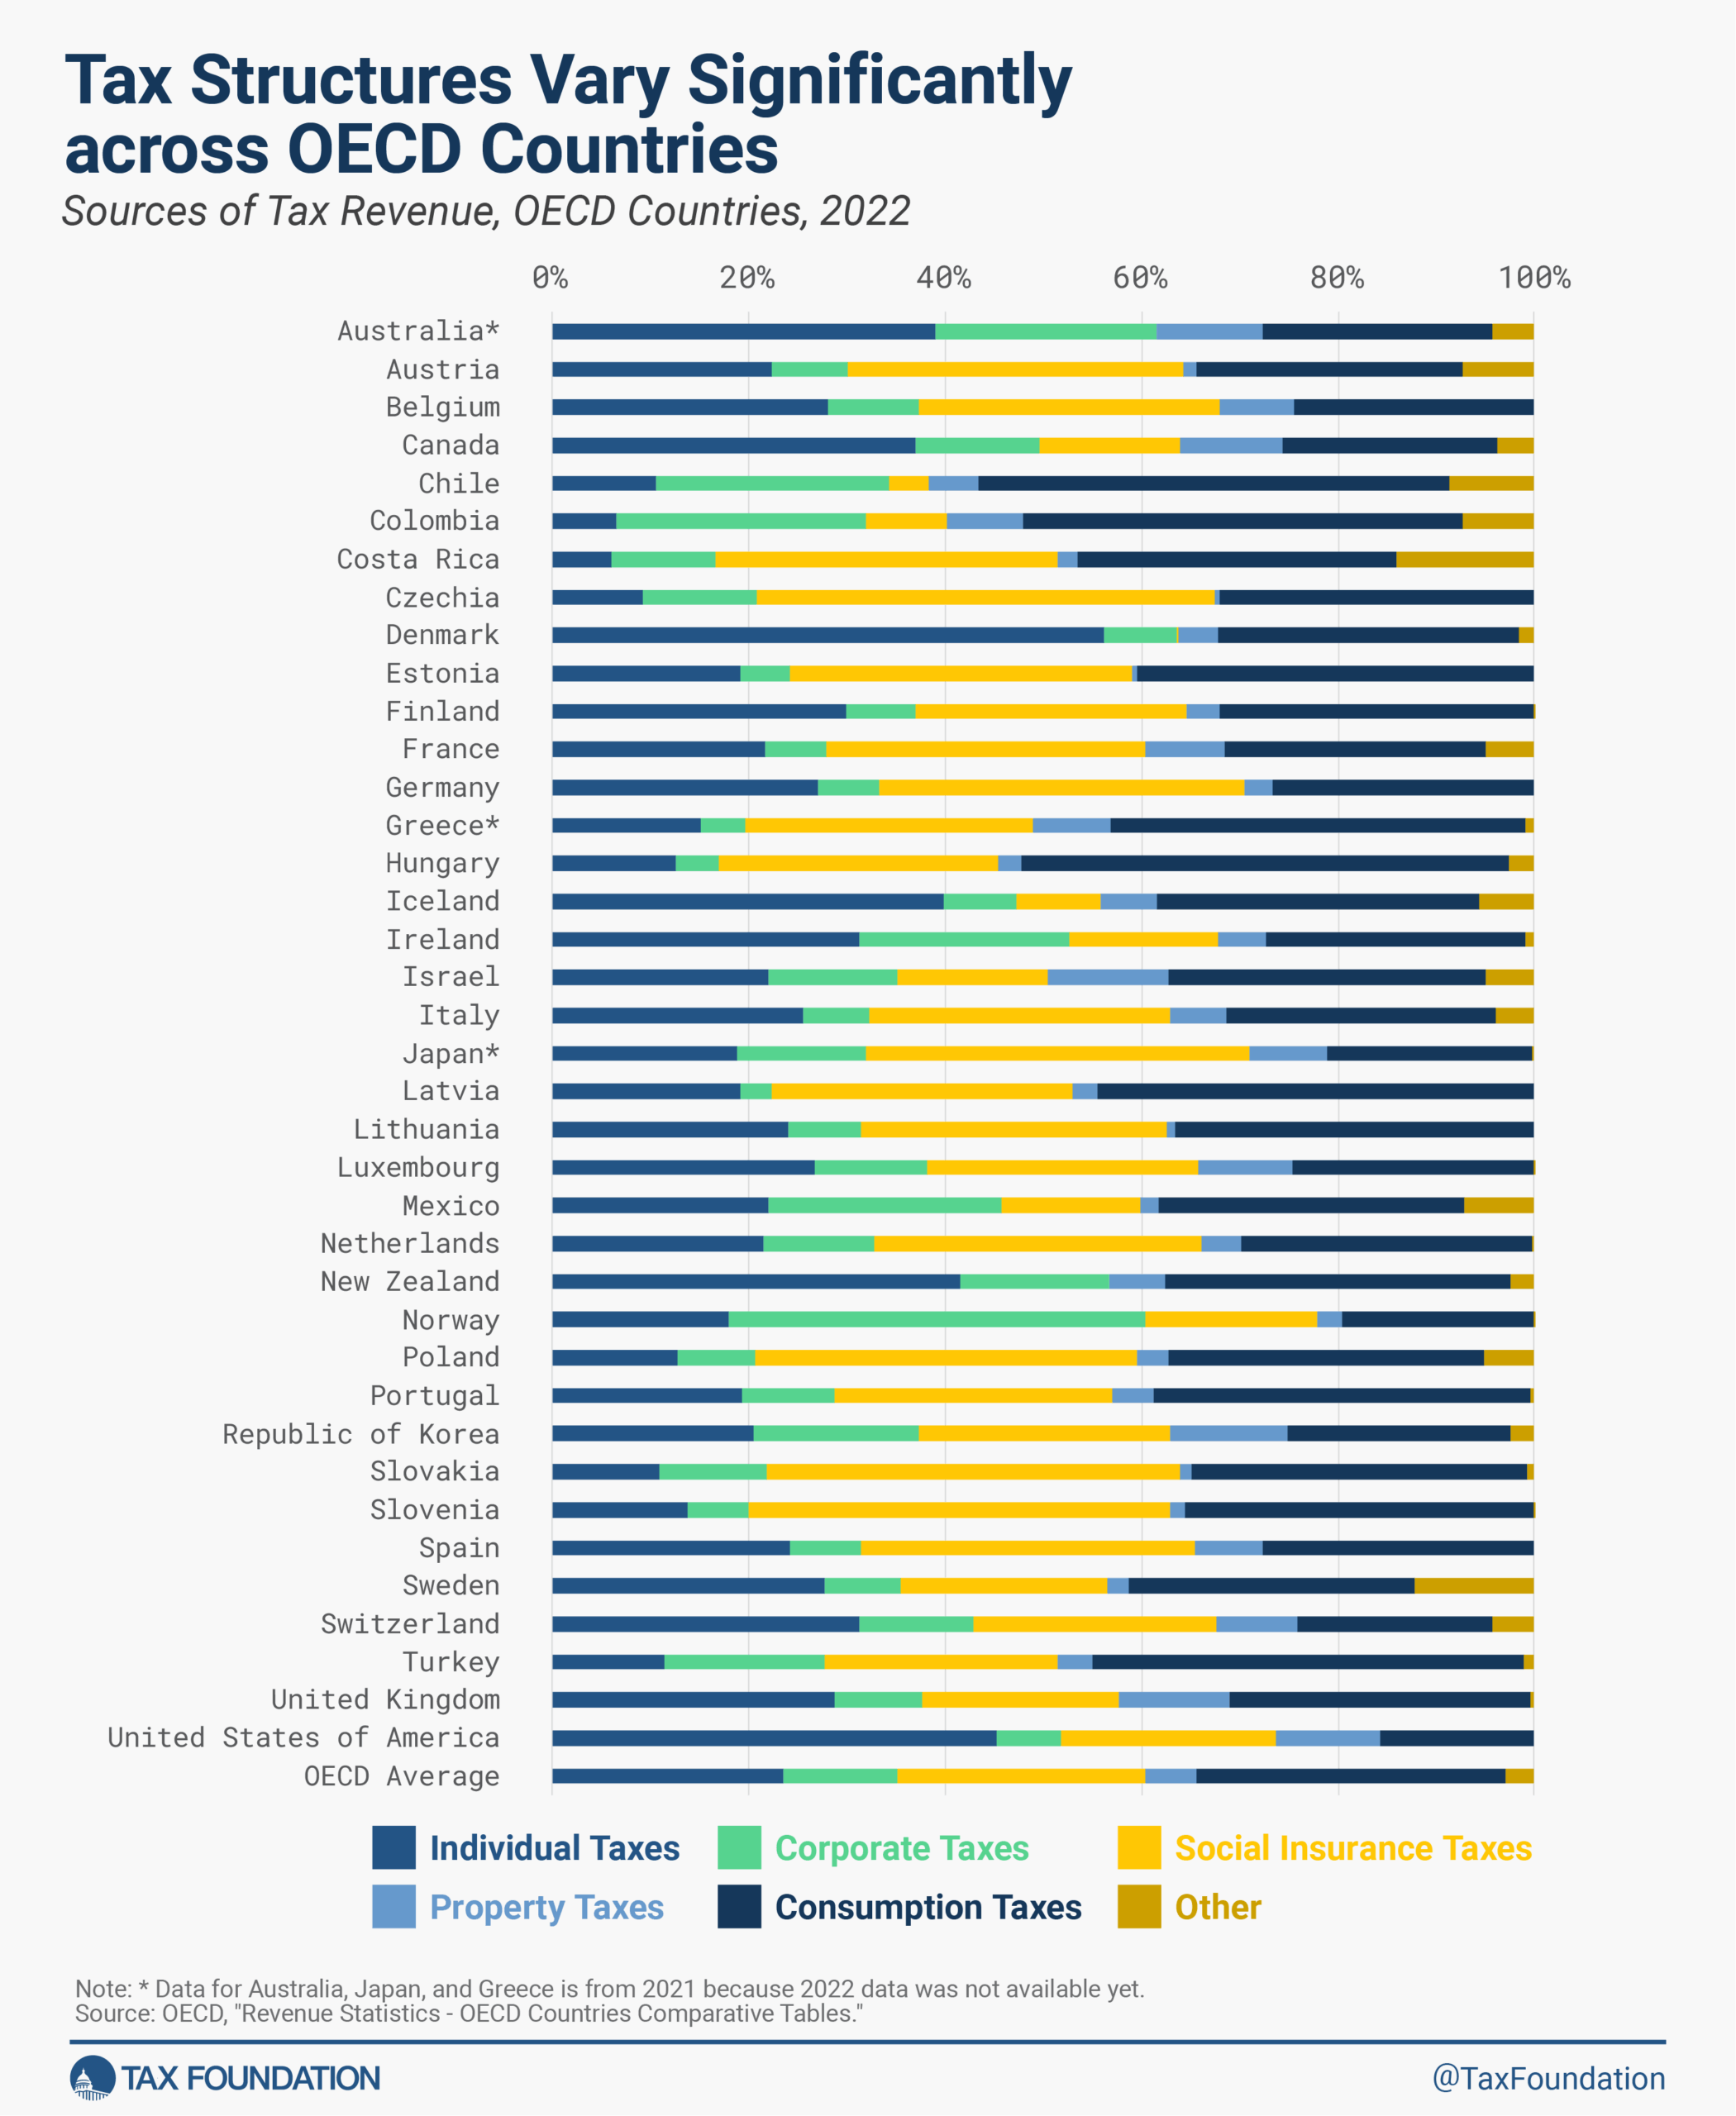
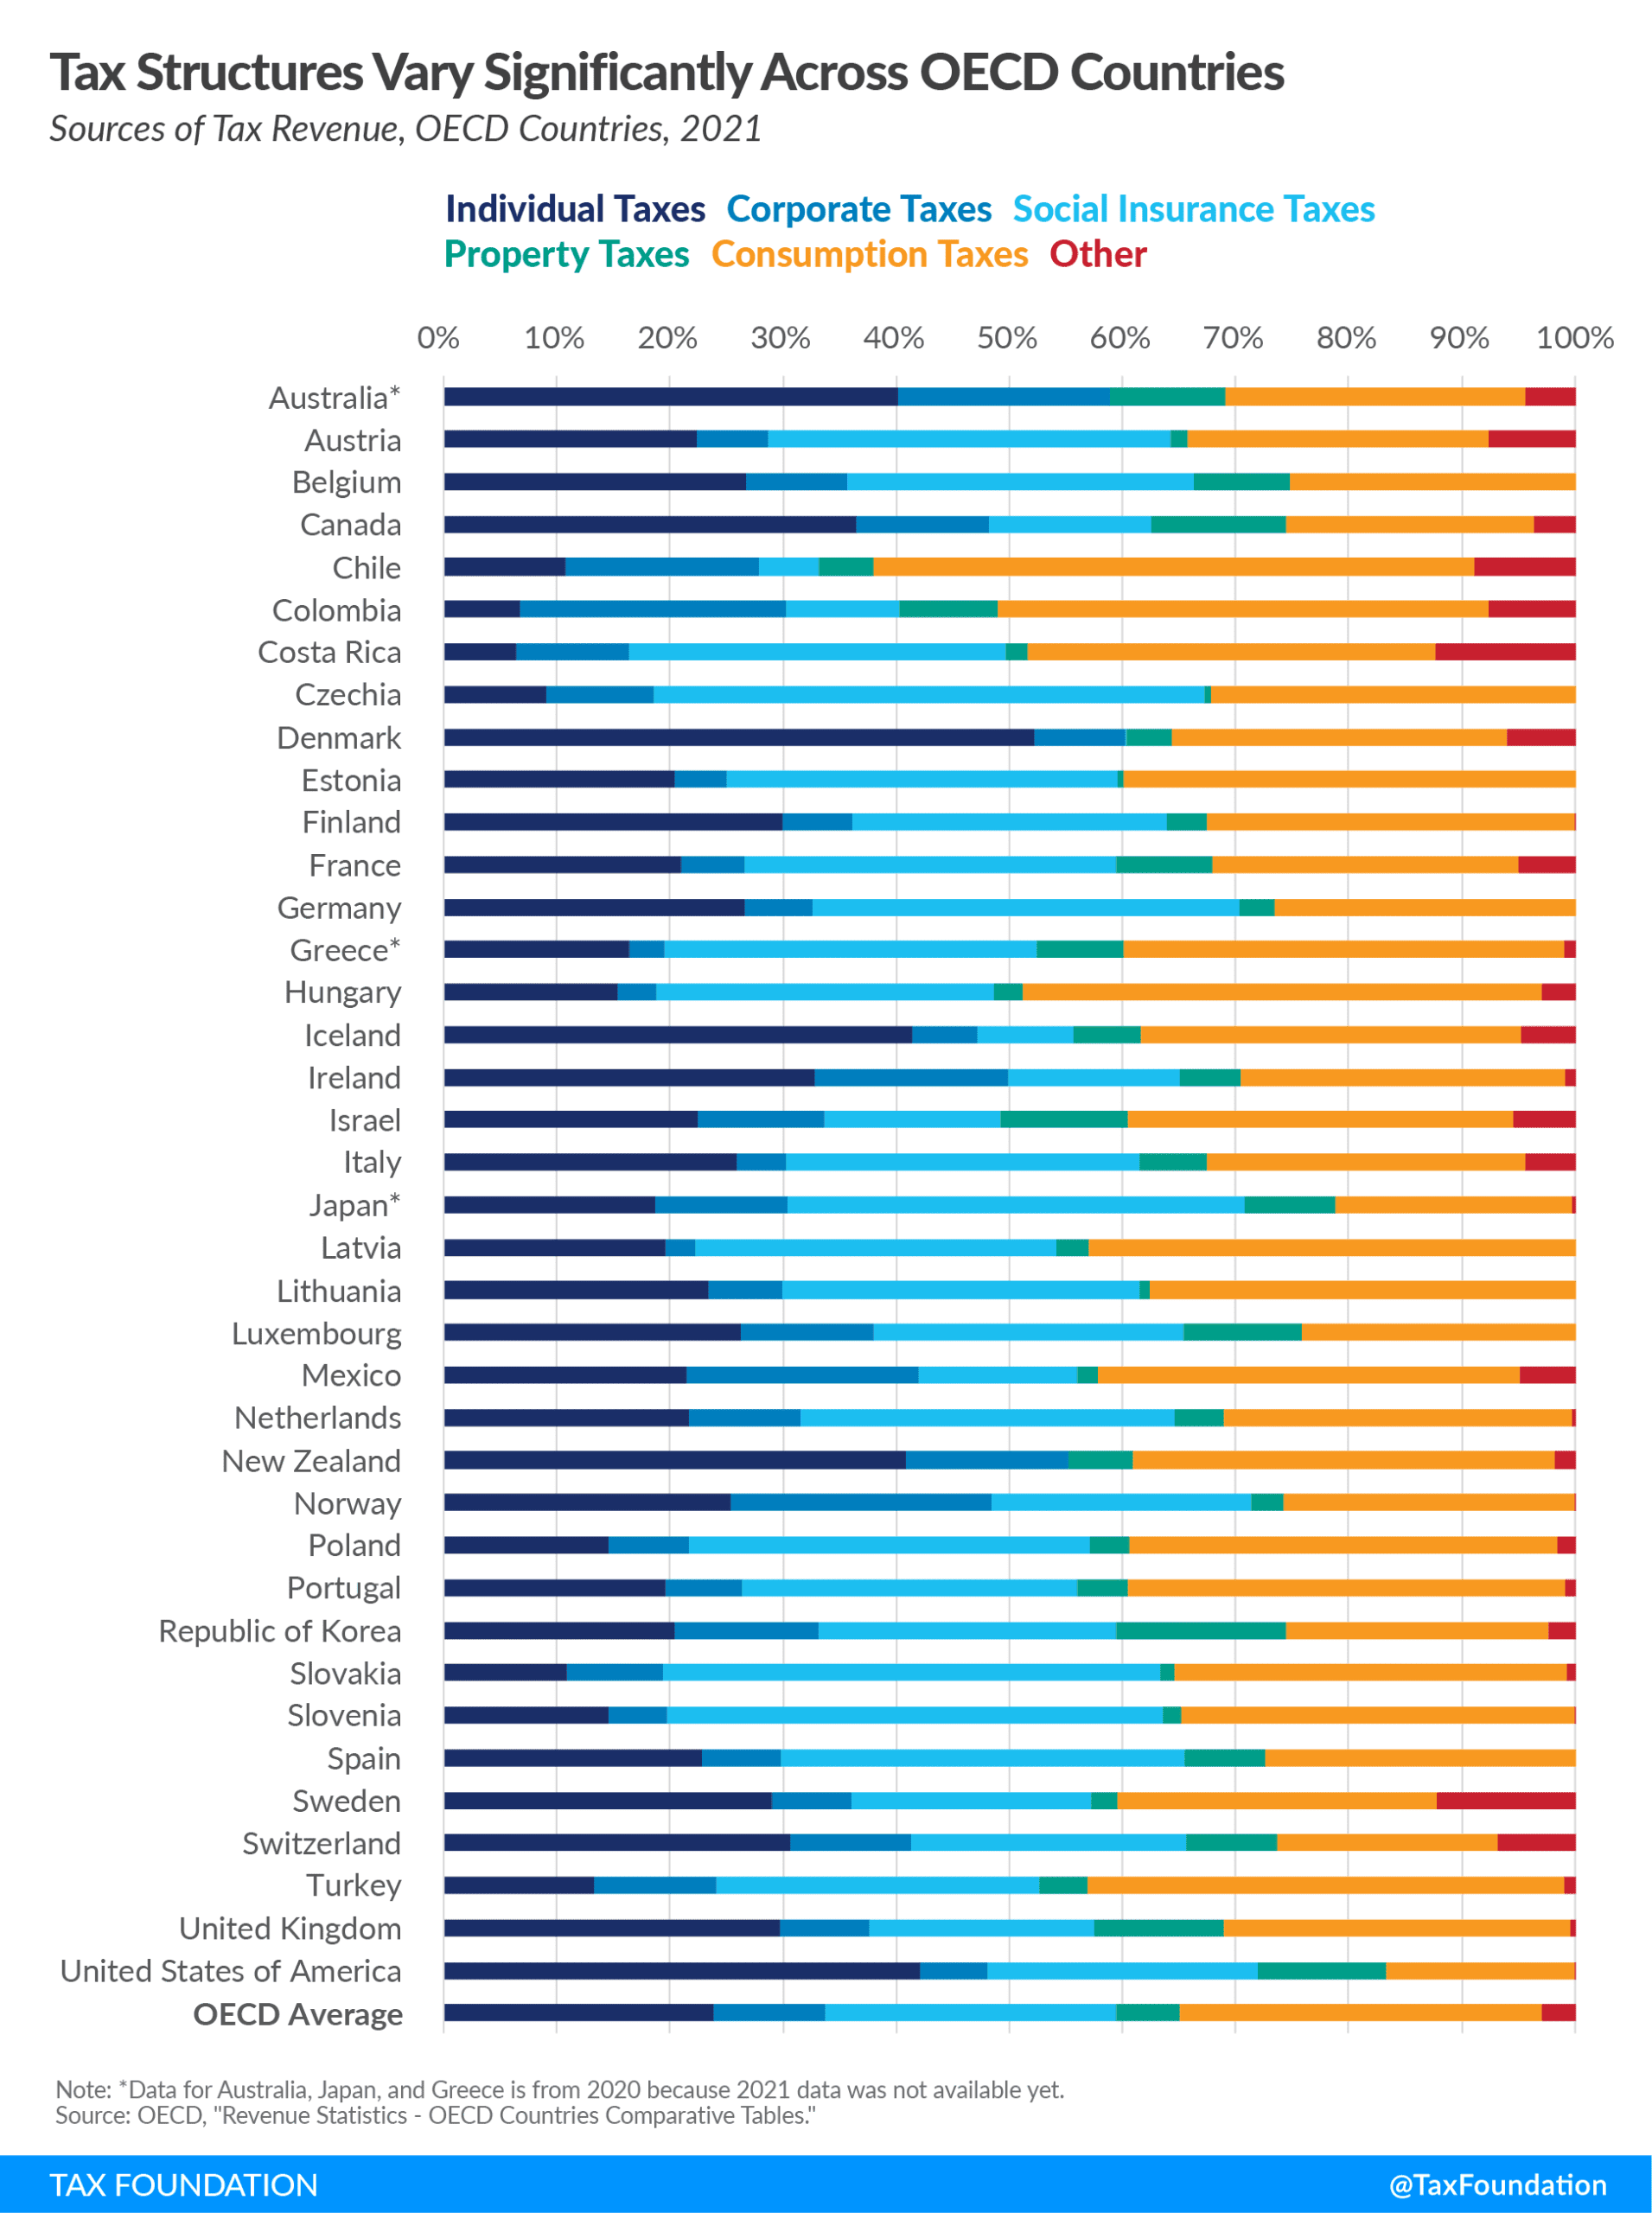
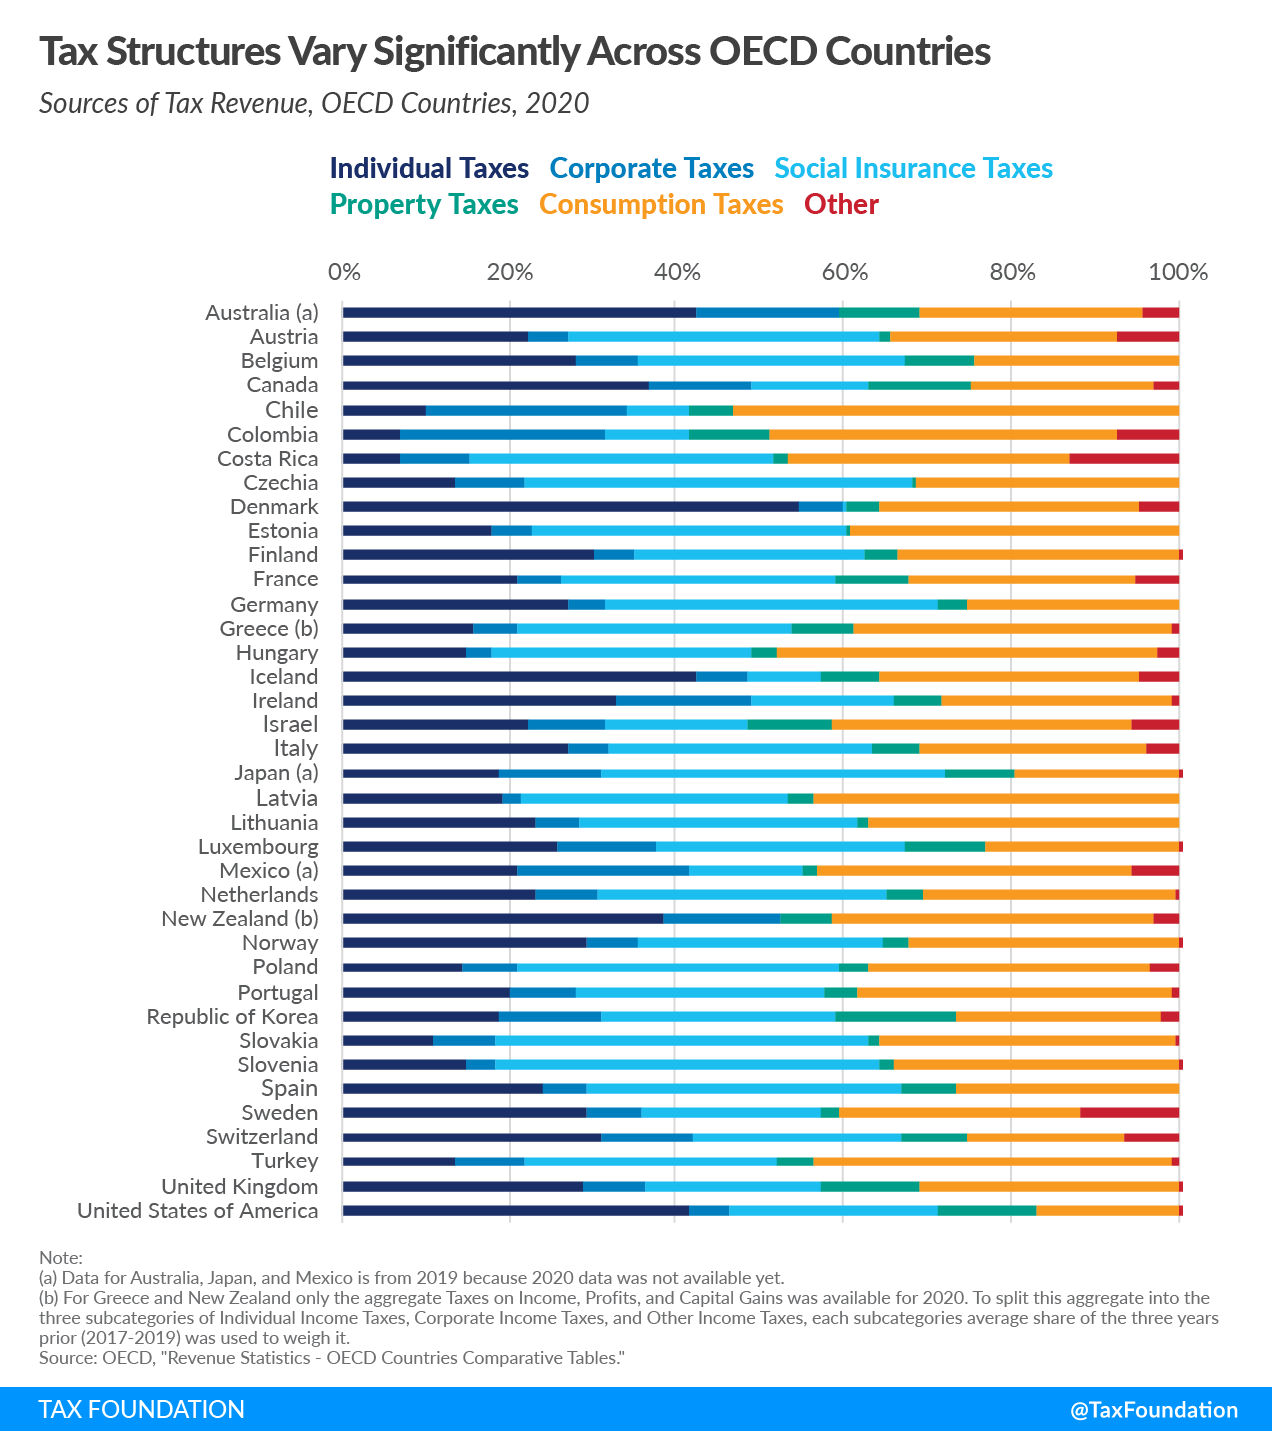
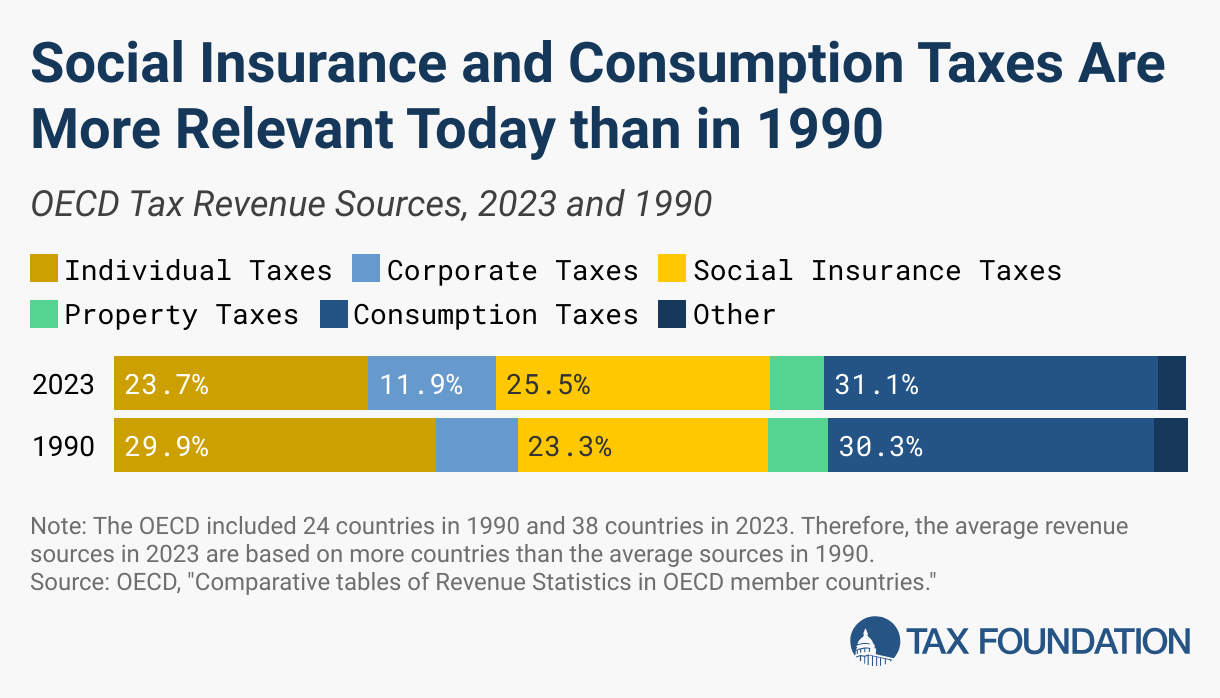
In general, OECD countries rely more on consumption taxes (31.1 percent), social insurance taxes (25.5 percent), and individual income taxes (23.7 percent) than on corporate income taxes (11.9 percent) and property taxes (5.1 percent).
The reliance on different types of taxes has shifted over time. Compared to 1990, OECD countries have on average become more reliant on social insurance taxes (an increase of 2.2 percentage points) and less reliant on individual income taxes (a decrease of 6.2 percentage points). These policy changes matter. Social insurance taxes generally have broader bases and lower rates, while taxes on personal income often have higher rates and can be more distortive to worker decisions. Additionally, social insurance contributions are less distortive than income taxes since they create entitlements for individual taxpayers, while income taxes do not.
OECD countries have also become more reliant on revenue from corporate income taxes. This has occurred despite a general decline in corporate tax rates around the world. One cause for this change has been a shift in the mix of OECD member countries. Since 1994, 14 countries have joined the OECD. Of this group, Chile, Colombia, and Mexico raise more than 20 percent of their revenue from corporate income taxes. The average share of corporate tax revenue among the 38 OECD countries is 11.9 percent.
The United States is the only country in the OECD without a value-added tax (VAT). Instead, most US state governments and many local governments apply a retail sales tax on the final sale of products and excise taxes on the production of goods such as cigarettes and alcohol. The lack of a VAT makes the US an outlier as it raises just 16.8 percent of total government revenue from consumption taxes while the OECD average is nearly twice that amount at 31.1 percent.
Designing tax policy in a way that sustainably finances government activities while minimizing distortions is important for supporting a productive economy. Policymakers should continue to explore ways to shift away from more distortive taxes like those on income toward taxes that are less likely to cause economic disruptions, like consumption or property taxes.