Key Findings
-
The U.S. system of taxes and transfers is highly progressive.
-
Measuring comprehensive income, inclusive of market-based income and government taxes and transfers, illustrates the total fiscal burden created by a fiscal system.
-
Income transfer programs amplify the U.S. federal taxA tax is a mandatory payment or charge collected by local, state, and national governments from individuals or businesses to cover the costs of general government services, goods, and activities. system’s progressivity, move the state and local system from moderate regressivity to moderate progressivity, and result in a highly progressive fiscal system overall.
-
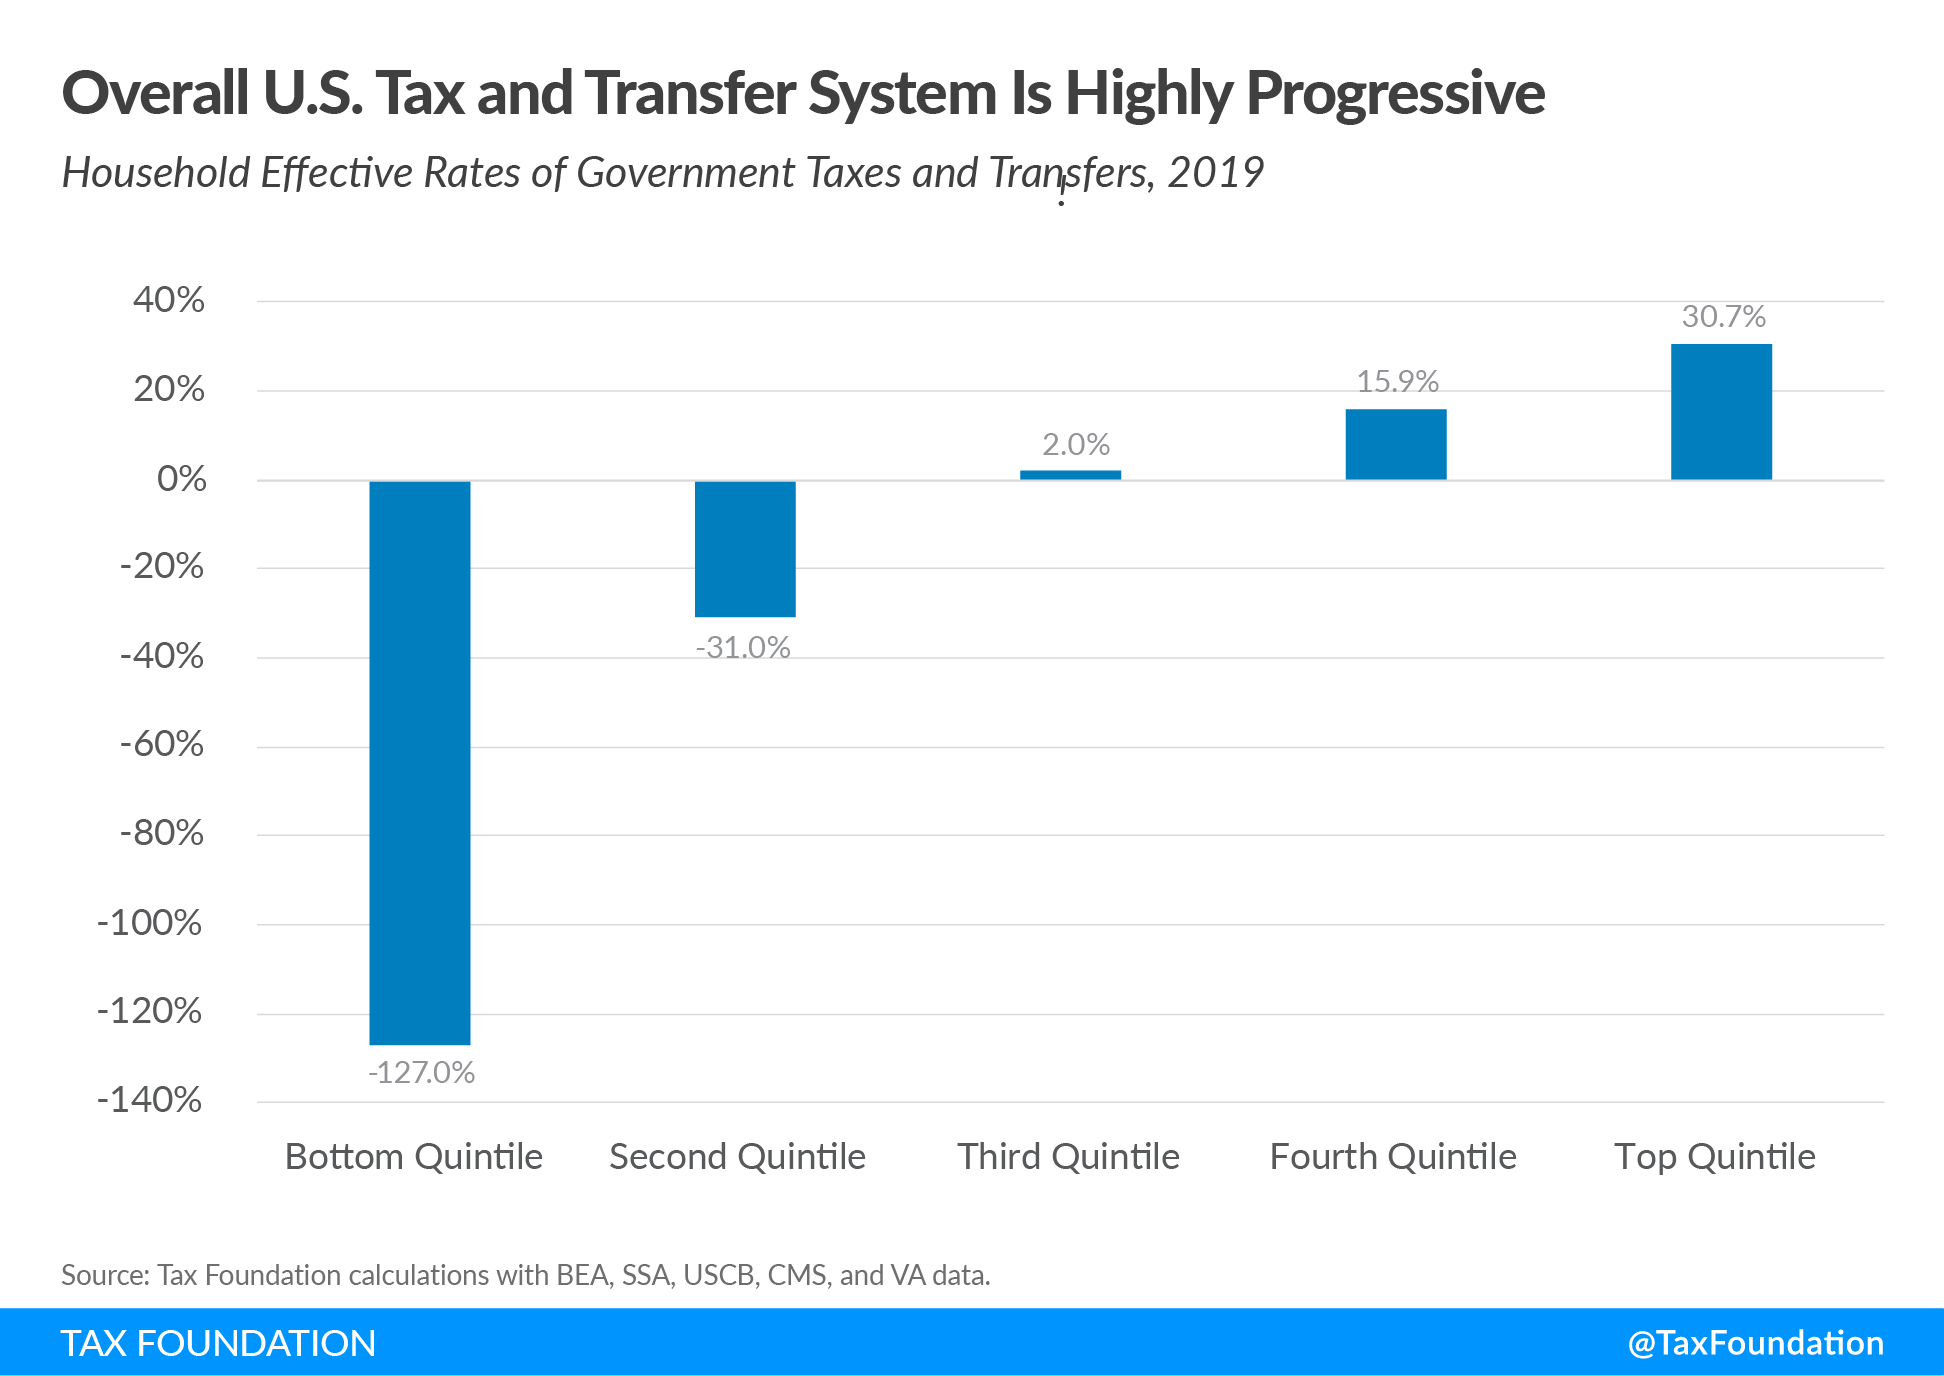
The lowest quintile experienced a combined tax and transfer rate of negative 127.0 percent, meaning that for each dollar they earned, they received an additional $1.27 from the government, netting transfers (gains) and taxes (losses), while the top quintile had a rate of positive 30.7 percent, meaning on net they paid just under $0.31 for every dollar earned.
-
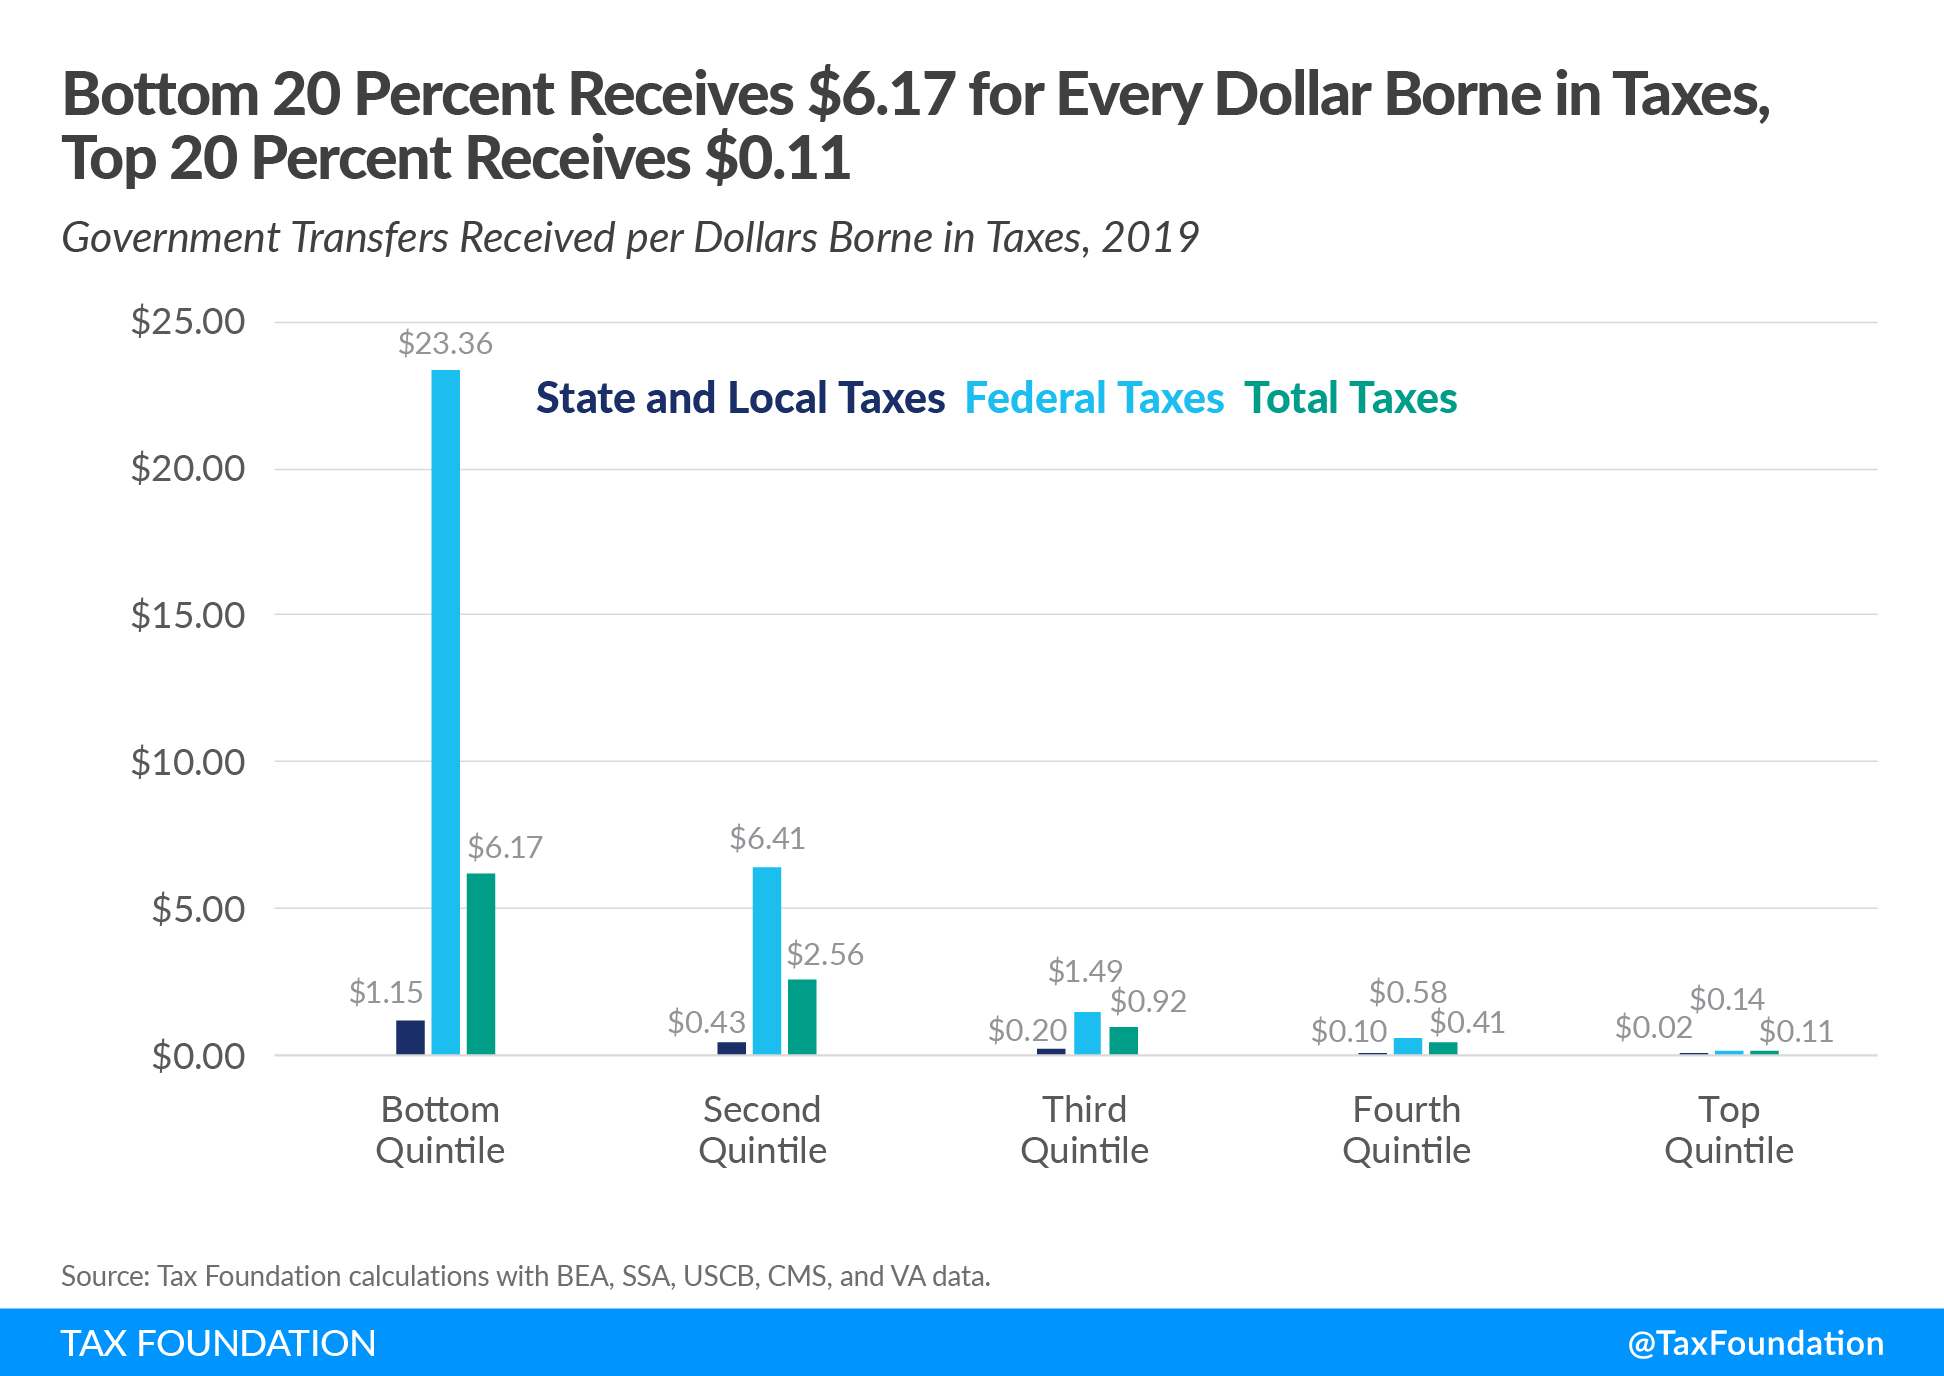
The top quintile funded 90.1 percent, or $1.6 trillion, of all government transfers in 2019. For each dollar of taxes paid, the top quintile received $0.11 in gross government transfers.
-
Government transfers account for 59 percent of the bottom quintile’s comprehensive income. For each dollar of taxes paid by the bottom quintile, they received $6.17 in gross government transfers.
-
Before transfers, total effective fiscal incidence rates were generally progressive: 24.6 percent for the bottom quintile, 24.7 percent for the middle quintile, and 34.5 percent for the top quintile.
-
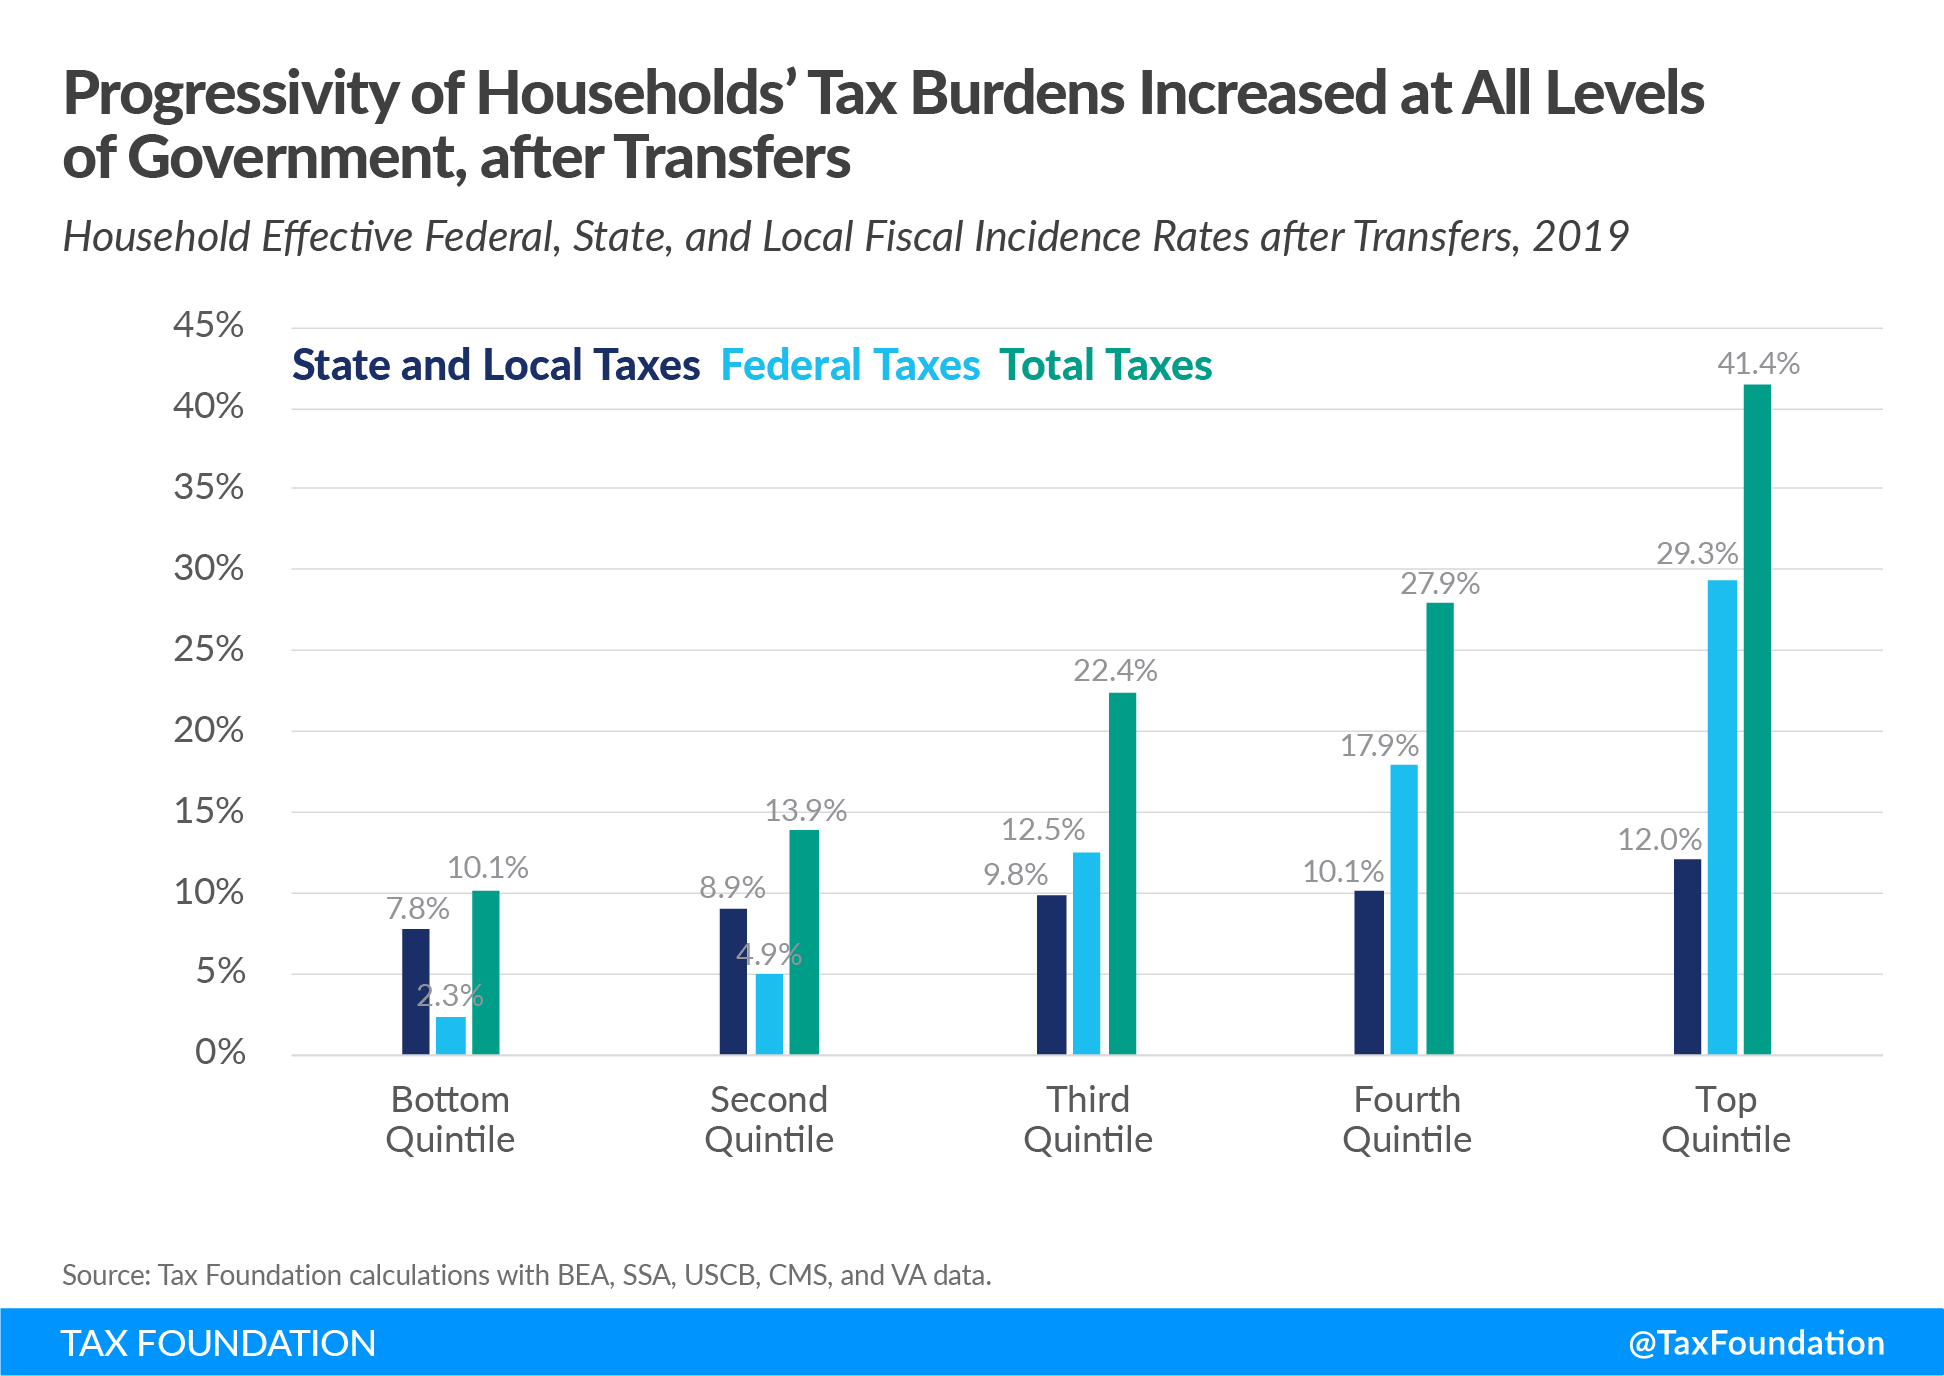
After transfers, total effective fiscal incidence rates were markedly progressive: 10.1 percent for the bottom quintile, 22.4 percent for the middle quintile, and 41.4 percent for the top quintile.
-
Including transfers in income decreased the effective state and local fiscal incidence rate for the bottom quintile by more than 11 percentage points to 7.8 percent. The middle quintile saw a 1 percentage point decrease to 9.9 percent, while the top quintile saw an increase of 2 percentage points to 12.1 percent.
-
About one-sixth of the tax burden borne by households in the lowest quintile is not personal taxes—like income, sales, and property taxes—but taxes remitted by businesses that are economically borne by taxpayers—like corporate income taxA corporate income tax (CIT) is levied by federal and state governments on business profits. Many companies are not subject to the CIT because they are taxed as pass-through businesses, with income reportable under the individual income tax. es, tariffs, severance taxes, and a variety of taxes on capital. Property taxes account for nearly one-third of the tax liability for this cohort, which includes both property taxes remitted directly by lower-income homeowners and those borne indirectly by renters.
Introduction
When policymakers or taxpayers discuss tax policy, the conversation inevitably turns to who pays, who should pay, and how much they should pay. To help inform the discussions, departments of revenue, policy organizations, and other researchers have analyzed where tax revenue comes from and how tax policy affects different groups of taxpayers.
Unfortunately, many studies about tax burdens and the progressivity of the tax system are incomplete—they fail to discuss how government transfers affect households’ tax burdens, and they neglect or insufficiently account for the economic incidence of some taxes that are ultimately borne by households. In 2007, the Tax Foundation produced a working paper examining the distribution of government spending and its impact on effective fiscal incidence rates between 1991 and 2004.[1] Now we are updating the study with the latest data, from 2019.
We find that the overall tax and transfer system in the United States is robustly progressive. The lowest quintile of Americans receives a net of 127 percent of their market income through the tax and transfer system, accounting for both the taxes they pay and the transfers they receive. At the other end of the spectrum, the top quintile gives up 31 percent of their market income due to taxes and transfers. Residents at both ends of the income spectrum pay taxes—directly and indirectly—and receive the benefit of government transfers, but for high earners, tax liability vastly outstrips the value of benefits received, whereas for low income-earners, tax payments pale in comparison to the value of transfers received.
At the federal level, both taxes and transfers are highly progressive, while at the state level, progressivity is largely achieved through transfers. This is unsurprising given the need for states to compete for jobs and investment and given the outsized role of the federal government in creating progressivity.
Our paper examines the burden and distribution of federal, state, and local tax and transfer systems. We first discuss the American approach to progressivity in the tax and transfer systems, then examine the distribution of taxation along the income spectrum before transfers. Later sections explore the implication of these transfers, the relationship between taxation and transfers, and their impact on the American tax systems’ progressivity at the national, state, and local levels. We conclude by highlighting some limitations of the study and summarizing the key findings, though one limitation is worth explaining here.
Household income is an annual “snapshot” measure, and thus corresponds imperfectly to wealth or ability to pay. A career middle-income earner might experience a year in the top quintile when selling a home or business, even though this is not representative of their “normal” income. More significantly for this study, some households of comfortable means have little or no income in a given year. There is a certain amount of statistical noise in the lowest quintile, which includes not only low-income, low-net-worth households, but also some affluent or even quite wealthy households that experienced income losses that year. A multimillionaire with a year of significant capital losses can show up in the bottom quintile but still have substantial property holdings and consumption subject to tax. This phenomenon is part of the reason the bottom quintile experiences higher effective rates of the pre-transfer tax burden than the second quintile: it includes some taxpayers who are not, by any measure, poor.
Finally, detailed tables, a glossary of terminology and concepts, and methodological notes can be found in the appendix for readers seeking a better understanding of this study’s inputs, but it should be noted here for all readers that our study focuses on the economic, not legal, incidence of taxes. It does not measure who remits tax payments to the government, but rather who is economically affected by a tax. A low-income family that rents an apartment, for instance, is understood in our study to bear a portion of the property taxA property tax is primarily levied on immovable property like land and buildings, as well as on tangible personal property that is movable, like vehicles and equipment. Property taxes are the single largest source of state and local revenue in the U.S. and help fund schools, roads, police, and other services. burden levied on that unit.
The U.S. Approach to Progressivity
Government fiscal policies can be progressive in two ways: either by imposing higher taxes and fees on higher earners or by devoting a greater share of government expenditures to lower-income households. In practice, governments invariably practice both, though the balance varies from country to country and state to state.
While European countries are generally, and correctly, regarded as having more progressive fiscal policies than the United States, this does not generally hold for their tax codes, which generate a far greater share of their revenue from low- and middle-income households than do tax systems in the United States. Instead, under systems of comparatively high and frequently regressive taxA regressive tax is one where the average tax burden decreases with income. Low-income taxpayers pay a disproportionate share of the tax burden, while middle- and high-income taxpayers shoulder a relatively small tax burden. es on all residents, these countries achieve high levels of progressivity through generous systems of public transfers.
In this, European countries operate much like U.S. states, where systemwide progressivity is achieved through spending. The U.S. federal government, by contrast, combines a highly progressive taxA progressive tax is one where the average tax burden increases with income. High-income families pay a disproportionate share of the tax burden, while low- and middle-income taxpayers shoulder a relatively small tax burden. system with a highly progressive transfer system. Local governments, which we treat in combination with state governments, generally have the least progressive systems, because they are not responsible for large-scale social welfare programs, which are within the purview of federal and state governments.
Given the high level of progressivity in the federal tax and transfer system, it makes sense for states to focus more of their efforts on the expenditure side of the ledger. States are in active competition with each other for people, jobs, and investment—all of which are considerably more mobile at the subnational than the international level. Critiques of the regressivity of state and local tax codes, which are often overstated, tend to ignore the progressivity of the state and local tax and transfer system in its entirety. They also tend to treat state fiscal policy in a vacuum, despite the substantial role of the federal government in the American system.
When considering the economic incidence of taxes on earners across the income spectrum, it becomes apparent that progressive intentions do not always yield a progressive reality. Income and capital-based taxes on business activity, tariffTariffs are taxes imposed by one country on goods or services imported from another country. Tariffs are trade barriers that raise prices and reduce available quantities of goods and services for U.S. businesses and consumers. s on imported goods, and property taxes on rental units are all borne by taxpayers across the income spectrum, even if they are not the ones legally obligated to remit the tax.
After accounting for transfers, effective fiscal incidence rates are highly progressive, with the bottom quintile facing an effective federal, state, and local rate of 10.1 percent, while the middle quintile bears 22.4 percent, and the top quintile faces a 41.4 percent burden. Even though much of this progressivity stems from the federal government, a similar effect is visible at the state and local level as well, with state and local effective rates ranging from 7.8 percent for the bottom quintile to 12.1 percent for the top quintile.
Finally, to say that the lowest quintile has a total federal, state, and local effective fiscal incidence rate of 10.1 percent is not to say that the tax and transfer system reduces that person’s income by about one-tenth. Rather, this is the effective tax burden on their total income including transfers, which account for 59 percent of the bottom quintile’s effective income.
Households in the bottom quintile received an effective net tax-and-transfer benefit of $1.27 for every dollar they earned in income—in other words, a tax-and-transfer rate of -127.0 percent. Households in the top quintile, on the other hand, experienced an effective reduction of $0.31 for every dollar they earned in income. Due to the highly progressive tax and transfer system, a household in the bottom quintile earned an average of $22,491 in pre-tax and transfer income but had approximately $54,900 in post-tax and transfer income, since they received an estimated $32,409 in net government transfers.
The Distribution of Tax Burdens
The comprehensive burden of a tax system can be assessed in three ways: by nominal amounts of tax borne; by effective fiscal incidence rates excluding government transfers; and by effective fiscal incidence rates including government transfers. We look at each measure in turn as well as the distribution of government transfers.
Estimated Tax Burden in Nominal Dollars
We begin by examining the amount of tax borne by each household income quintile in 2019. The top quintile bears the majority of the total tax burden, bearing five times more than the middle quintile and nearly 23 times the bottom quintile. At the state and local level, the top quintile bears an amount nearly as large as all other quintiles combined, bearing $3.23 trillion in taxes, compared to $142 billion borne by the lowest quintile.
On average, households in the top quintile had a total estimated tax burden of $125,748 in 2019, consisting of $89,055 in federal taxes and $36,693 in state and local taxes. The middle and bottom quintiles bore a much smaller total tax burden of $24,451 and $5,524, respectively.[2] Notably, these tax burdens include taxes paid on economic activity underwritten by transfer payments, not just on their pre-transfer market income, which makes more of a difference for low-income households.
| Bottom Quintile | Second Quintile | Third Quintile | Fourth Quintile | Top Quintile | |
|---|---|---|---|---|---|
| Total Tax Burden (Billions) | $142 | $292 | $628 | $1,145 | $3,230 |
| Total Federal Tax Burden (Billions) | $32 | $104 | $351 | $733 | $2,288 |
| Total State Tax Burden (Billions) | $110 | $188 | $277 | $413 | $943 |
| Total Tax Burden per Household | $5,524 | $11,386 | $24,451 | $44,580 | $125,748 |
| Federal Tax Burden per Household | $1,248 | $4,053 | $13,678 | $28,516 | $89,055 |
| State and Local Tax Burden per Household | $4,275 | $7,332 | $10,773 | $16,064 | $36,693 |
|
Source: Bureau of Economic Analysis; Tax Foundation calculations. |
|||||
Effective Fiscal Incidence Rates on Market-Derived Income
A second approach to examining the burden of a tax system is to consider effective fiscal incidence rates on market-derived income. Effective fiscal incidence rates illustrate the estimated tax burden as a share of income. Market-derived income includes all earned income from active participation in a job or business venture as well as all passive income resulting from the receipt of dividends, interest, or rent and excludes public or private transfers.
Figure 2 illustrates the effective fiscal incidence rates at each level of government absent the impact of income transfer programs. In the absence of transfers, the federal tax system is progressive, while the state and local tax system is regressive. The result is an overall tax system that resembles something of a fishhook, where incidence rates at the bottom quintile are slightly higher than at the second quintile, after which the progressive pattern resumes. Part of this effect can be explained by high-net-worth households that experienced negative income flows in the snapshot year.
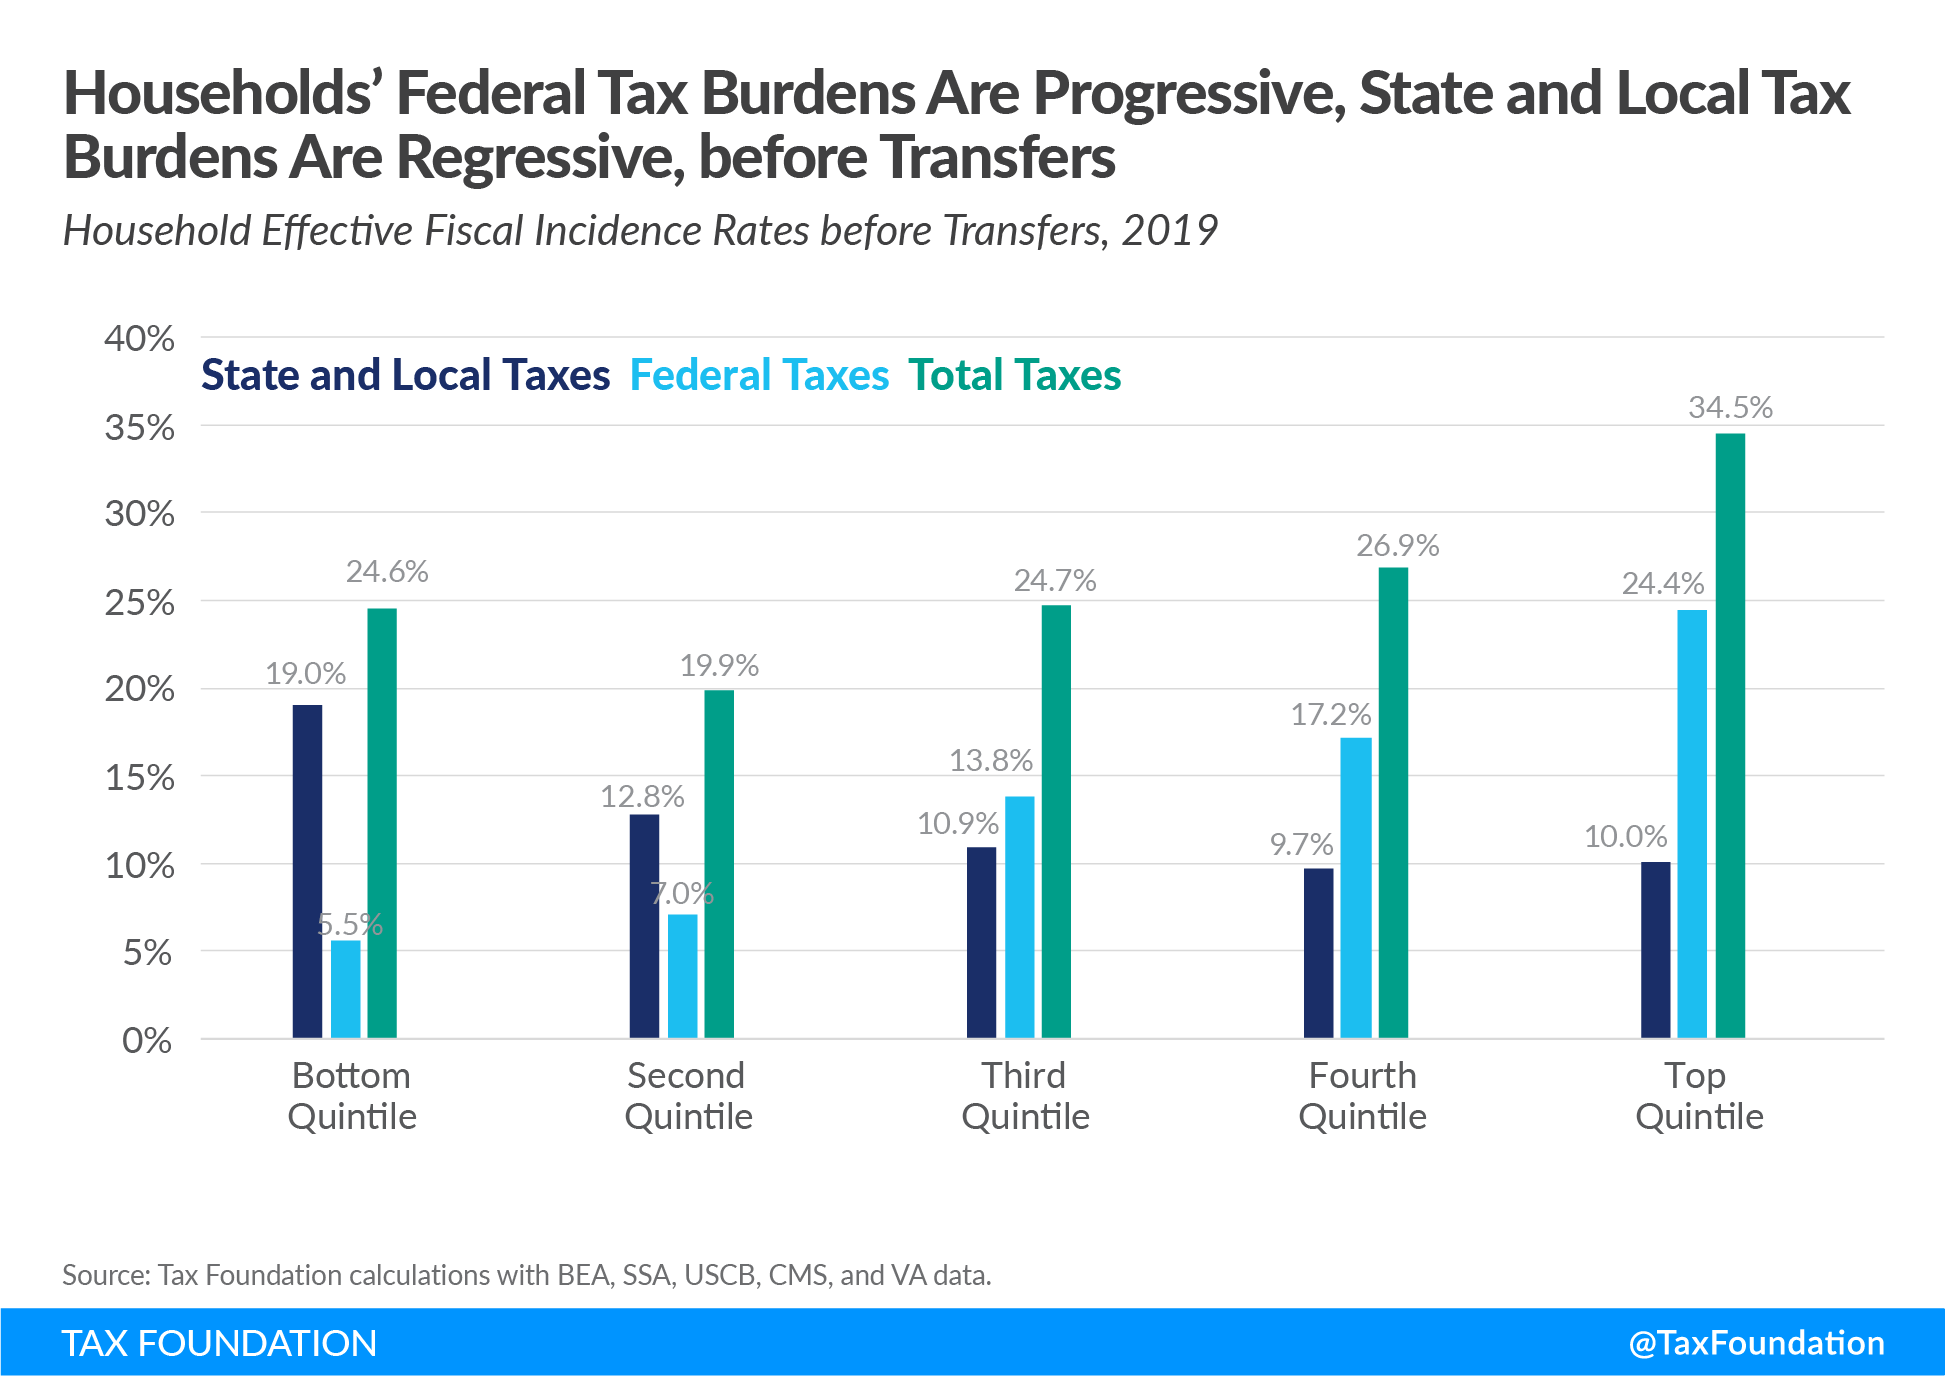
Prior to government transfers, the bottom quintile faced an effective federal fiscal incidence rate of 5.6 percent, the middle quintile 13.8 percent, and the top quintile 24.4 percent.
Isolating state and local government effective fiscal incidence rates before transfers, the subnational system is markedly regressive. The bottom quintile of households realized a tax burden equivalent to 19 percent of their market-derived household income, the middle quintile’s burden was 10.9 percent, and the top quintile’s burden was 10.1 percent.
A key reason for the regressivity in the state and local system is the inclusion of more consumption-based taxes, which tend to be borne by consumers. While consumption taxes are economically efficient in that they only tax people for what they use, the burden falls harder on lower-income households because they consume a larger portion of their income than higher-income households do. Additionally, many of the services consumed by higher-income households are excluded from sales taxA sales tax is levied on retail sales of goods and services and, ideally, should apply to all final consumption with few exemptions. Many governments exempt goods like groceries; base broadening, such as including groceries, could keep rates lower. A sales tax should exempt business-to-business transactions which, when taxed, cause tax pyramiding. bases. Though in dollar terms, higher-income households pay more in total consumption taxes, effective fiscal incidence rates for state sales taxes are higher for lower-income households.[3] Moreover, commercial property taxes are often higher than residential property taxes, which actually works against many lower-income households despite superficially seeming like a progressive measure targeting businesses, since multi-unit rental properties are assessed as commercial rather than residential properties.
The Impact of Transfer Programs on Effective Fiscal Incidence Rates
A third approach to examining a tax system’s burden is assessing effective fiscal incidence rates including government transfer programs. Government transfers can account for a significant portion of many lower-income households’ ability to pay for goods and services. Because money is fungible, meaning a dollar from one source can be interchanged with a dollar from another, households can shift market-derived income to other uses when they receive government transfers. As households consume other goods or services they would not otherwise have been able to afford, they may also end up paying more in taxes.
Transfers at both levels of government have progressive distributions. The bottom quintile receives the largest share of gross transfers from the federal government (27.8 percent) and from state and local government (38.7 percent), while the top quintile received the smallest shares of federal and state and local gross transfers, 6.7 and 12.2 percent, respectively. Gross federal transfers made up the largest share of transfers for the top four quintiles, while the bottom quintile had a larger share of state and local transfers, the result of the state portion of Medicaid and other means-tested social assistance programs.
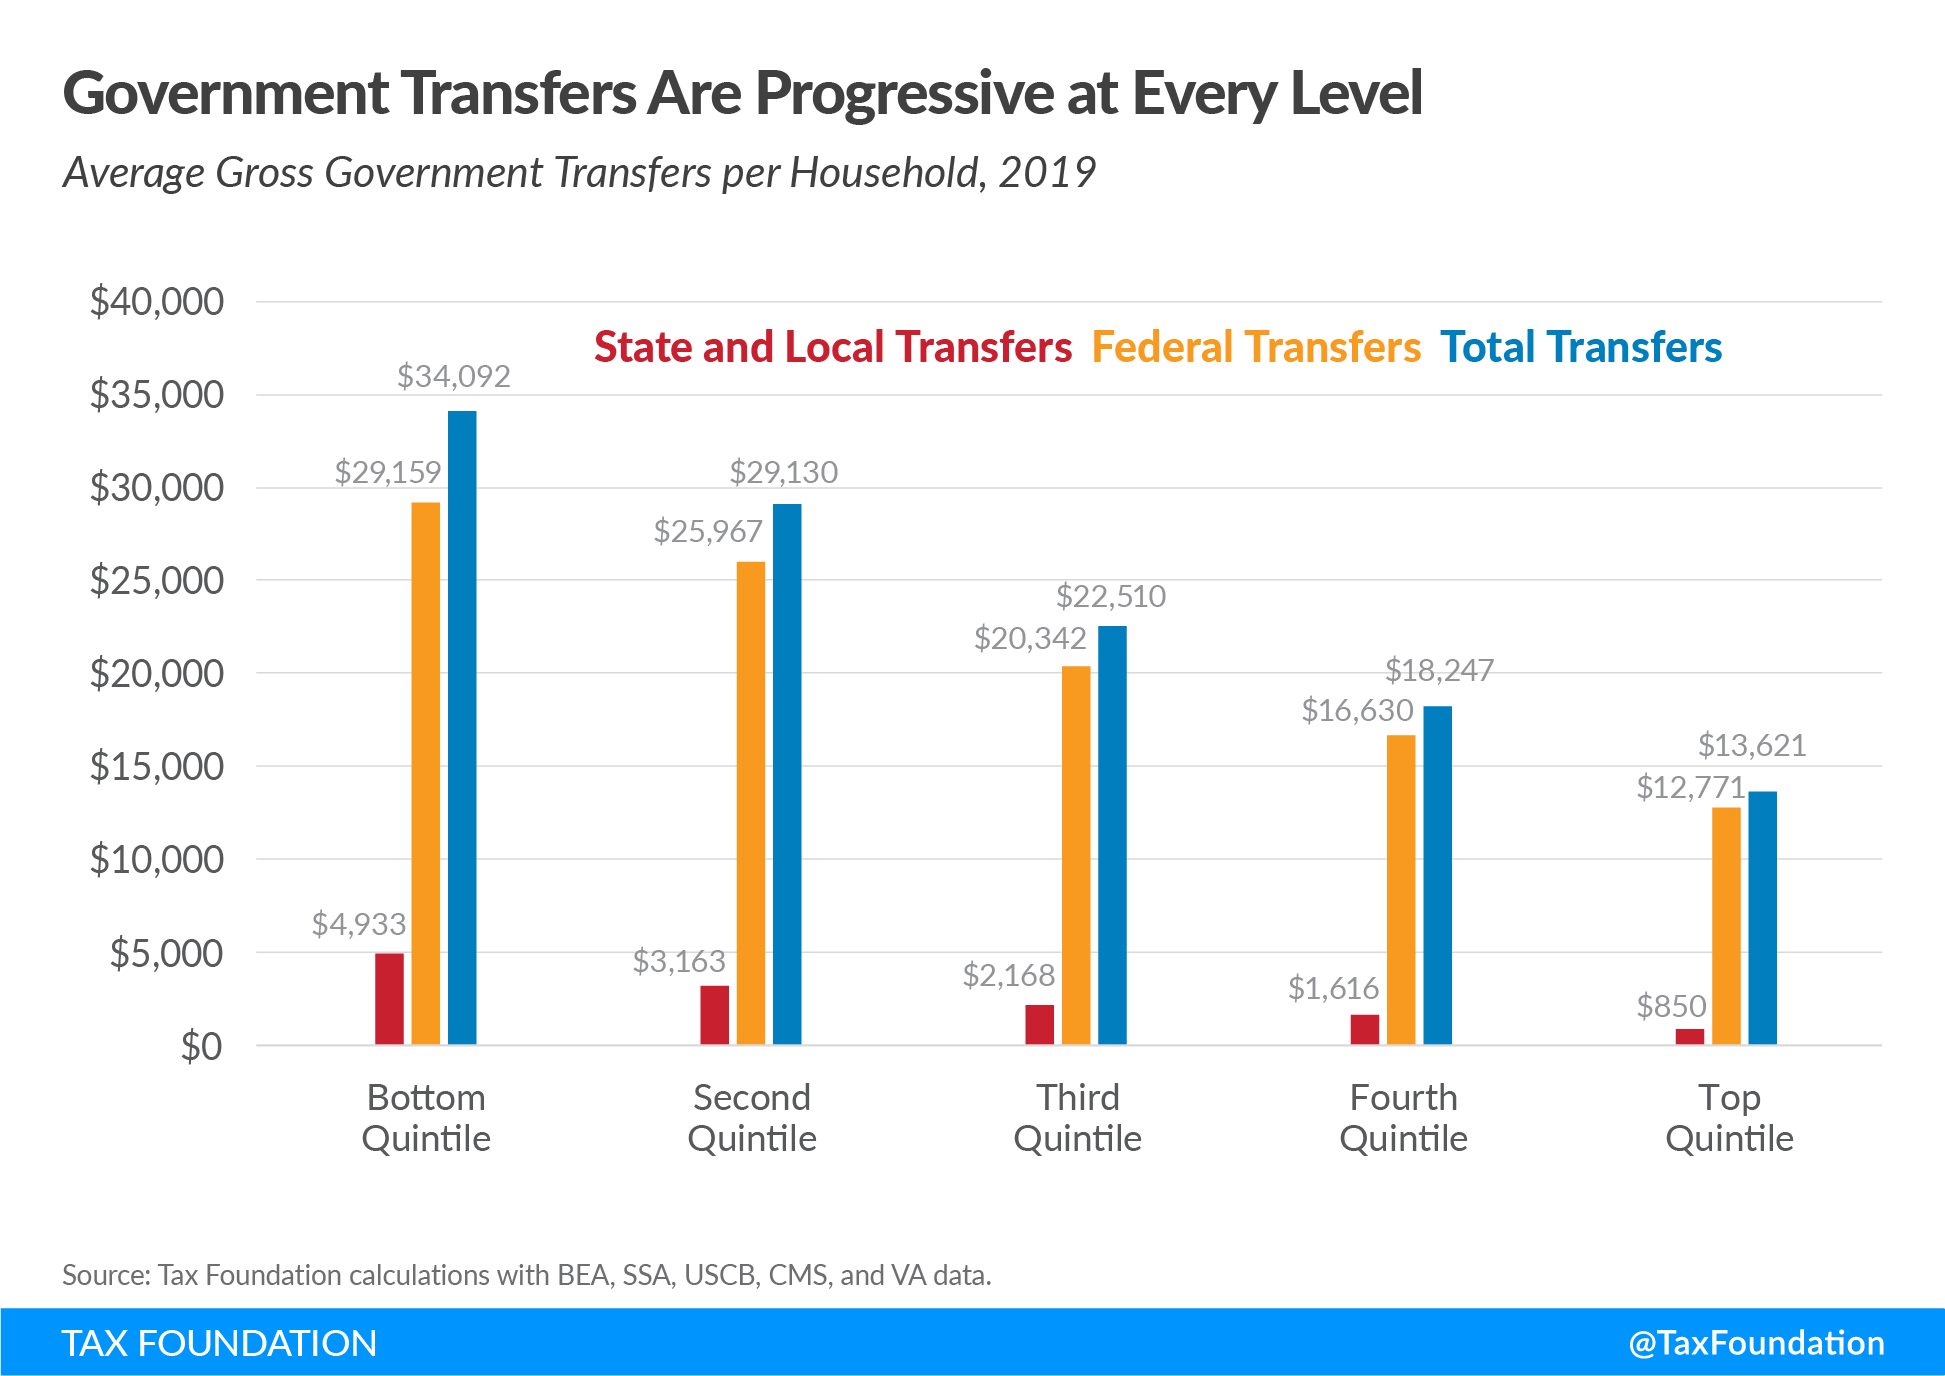
Gross Government Transfer Payments
As Figure 3 illustrates, federal transfers are much larger in dollar terms than state and local transfers. The average household in the bottom quintile received an estimated $34,092 in total gross government transfers, made up of $29,159 in federal transfers and $4,933 in state and local transfers. By comparison, the average household in the middle quintile received $22,510 in transfers, while the average household in the top quintile received $13,621.
The gross transfer figures do not consider associated taxes that pay for the various programs. Before funds can be distributed to qualifying households, they must first be collected through taxation. To avoid double counting income, the tax cost of government transfers must be subtracted from the amount of transfers received. Failing to do so would make government transfer programs appear less progressive than they actually are.
It may be surprising to learn that the top quintile accrued nearly $350 billion in government transfers, programs normally thought of as helping lower-income earners.[4] It is perhaps less of a surprise when one considers that the measure includes Medicare and retirement programs like Social Security, which have broad eligibility criteria.
Overall, households earned $18.2 trillion of market income, with $7.8 trillion going to the top quintile, $2.8 trillion to the middle quintile, and $1.4 trillion to the bottom quintile after transfers.
| Bottom Quintile | Second Quintile | Third Quintile | Fourth Quintile | Top Quintile | |
|---|---|---|---|---|---|
| Total Comprehensive Household Income (Billions) | $1,410 | $2,107 | $2,807 | $4,097 | $7,801 |
|
Source: Tax Foundation calculations with BEA, SSA, USCM, CMS, and VA data. |
|||||
Including income transfer programs presents a more complete picture of how the fiscal system affects households, as illustrated in Figure 4. It becomes clear that all levels of the U.S. tax and transfer system have a progressive impact on taxpayers. After transfers, the top quintile had a combined effective fiscal incidence rate of 41.4 percent compared to 22.4 percent for the middle quintile and 10.1 percent for the bottom quintile.
A careful comparison between Figure 2 and Figure 4 shows the effective fiscal incidence rates of the top and bottom quintiles changed dramatically after transfers. The top quintile’s total effective fiscal incidence rate increased by nearly 7 percentage points while the same rate for the bottom quintile fell by 14.5 percentage points. This is because, after accounting for the taxes necessary for redistribution to occur, the transfer system effectively redistributed $1.7 trillion, which dramatically alters the denominator in each quintile.
The top two quintiles were responsible for the income redistributed to the bottom three quintiles, with the top quintile responsible for funding 90.5 percent ($1.6 trillion). In all, the bottom quintile received $832.5 billion of redistributed income. The second and third quintiles of households received the remaining net transfers.[5]
With transfers included in income, the effective federal and combined fiscal incidence rates for the bottom three quintiles decreased while the rates for the top two quintiles increased relative to the respective pre-transfer rates.
The effective state and local tax rates also become progressive across the income distribution. The effective fiscal incidence rate for the bottom quintile decreased more than 11 percentage points to 7.8 percent. The middle quintile saw a 1 percentage point decrease in its effective rate to 9.9 percent, while the top quintile saw an effective state and local fiscal incidence rate increase of 2 percentage points to 12.1 percent.[6]
When the cost of government transfers was subtracted from gross transfers received, the fiscal incidence of the tax and transfer system becomes even clearer. After accounting for the tax burden to fund transfer programs attributable to transfer income, the bottom quintile came out $32,409 ahead, on average. A household in the middle quintile came out $10,180 ahead, while the average top quintile household paid $60,989 to fund transfer programs.[7]
| Bottom Quintile | Second Quintile | Third Quintile | Fourth Quintile | Top Quintile | |
|---|---|---|---|---|---|
| Before Transfers | |||||
| Effective Fiscal Incidence Rate | 24.6% | 19.9% | 24.7% | 26.9% | 34.5% |
| Effective Federal Fiscal Incidence Rate | 5.6% | 7.1% | 13.8% | 17.2% | 24.4% |
| Effective State and Local Fiscal Incidence Rate | 19.0% | 12.8% | 10.9% | 9.7% | 10.1% |
| After Transfers | |||||
| Effective Fiscal Incidence Rate | 10.1% | 13.9% | 22.4% | 28.0% | 41.4% |
| Effective Federal Fiscal Incidence Rate | 2.3% | 4.9% | 12.5% | 17.9% | 29.3% |
| Effective State and Local Fiscal Incidence Rate | 7.8% | 8.9% | 9.9% | 10.1% | 12.1% |
|
Source: Tax Foundation calculations with BEA, SSA, USCB, CMS, and VA data. |
|||||
The effective transfer rates, measured as net transfer amounts divided by comprehensive household income, across the income distribution are also highly progressive. Figure 7 illustrates that 59 percent of comprehensive income for households in the bottom quintile came from government transfers. The share declines sharply across the rest of the income distribution. For the second quintile, 30 percent of comprehensive household income came from net government transfers compared to only 9 percent of income for the middle quintile. Meanwhile, the taxes used to fund transfer programs reduced the top quintile’s market-derived income by 16.7 percent, an amount equivalent to 20 percent of its comprehensive household income.[8]
Put differently, for every dollar borne in taxes, the average household in the bottom 20 percent received $6.17 in gross incomeFor individuals, gross income is the total pre-tax earnings from wages, tips, investments, interest, and other forms of income and is also referred to as “gross pay.” For businesses, gross income is total revenue minus cost of goods sold and is also known as “gross profit” or “gross margin.” transfers, the average household in the middle 20 percent received $0.92, and the top 20 percent received $0.11. In totality, the current tax and transfer system is highly progressive.
Finally, it is possible to combine these data to calculate an effective fiscal incidence rate as a percentage of pre-tax income. Households in all quintiles benefit from gross government transfers, since some transfer programs, like Social Security and Medicare, are broadly available. However, social spending is concentrated among lower- and middle-income households, while tax burdens are concentrated on higher earners, resulting in a tax-and-transfer system that more than doubles the income of households in the bottom quintile while reducing after-tax and transfer income by 30.7 percent for the top quintile of filers. The middle quintile pays slightly more in taxes than it receives in government transfers.
| Bottom Quintile | Second Quintile | Third Quintile | Fourth Quintile | Top Quintile | |
|---|---|---|---|---|---|
| Household Effective Rates of Gov’t Taxes and Transfers | -127.0% | -31.0% | 2.0% | 15.9% | 30.7% |
Limitations
This study only considered the impact of cash and in-kind transfer programs on effective tax burdens. Other studies, including the 2007 Tax Foundation working paper, considered the effect expenditures on a broader range of public goods had on effective fiscal incidence rates. However, since public goods are by definition nonrivalrous and nonexclusionary they present unique data limitations. It is difficult to derive how much benefit the average household receives from such public goods as national defense, fire protection, or road networks for example. Attempting to derive that value would be a significant undertaking and unlikely to add meaningfully to a household’s economic income. As a result, we focused exclusively on government expenditures that took place through the government transfer programs specified earlier.
As mentioned previously, the bottom income quintile likely includes several wealthy households. Aggregating data into quintiles, while a common way of analyzing the income spectrum, can mask important observations that may become apparent at the decile or centile level. This is especially salient in a study of income where wealthy households may end up in the lowest quintile simply because significant financial losses offset the revenue earned that year. Income is not wealth, yet many taxes, particularly property taxes, can be paid out of or reflect a household’s accumulation of wealth. Some indications in this study that suggest this may be the case include the number of vehicles owned and the education level attained by the members of households in the lowest income quintile. Examining this quintile in greater detail is an opportunity for future research.
In-kind and cash transfers are important factors to consider in any discussion of household income. Especially among lower-income families, transfers amount to a large share of their comprehensive income. As our study illustrates, a complete measure of federal, state, and local taxes and transfers reveals a highly progressive fiscal system. Though in isolation, certain components of the system, such as state and local taxes, are regressive, a complete accounting of tax and transfer policies shows the final outcome is highly progressive. Leaving transfers out of the picture understates the tax burden on high-income earners, overstates the burden on low-income earners, and fails to inform the policy debate over who should pay and how much.
Conclusion
The importance of accurately defining taxpayers’ burdens lies in the implications for the economy and the motivation for the transfer system. Tax policies are often evaluated on their progressivity or regressivity in a vacuum, without an adequate understanding of the broader system in which they operate. When, at times, progressivity is in tension with other goals, including neutrality and an orientation toward economic growth, policymakers deserve to have a proper understanding of the overall progressivity of the tax and transfer system, and the different levers that are used to achieve it, so they can better evaluate if and how to prioritize progressivity in discrete cases.
States compete with each other for residents, jobs, and capital investment, all of which are much more mobile at the subnational than at the international level. To a significant degree, the federal government has long been the primary source of progressivity—through both taxes and transfers—enabling state governments to pursue other worthy aims through their own tax codes. This does not end the conversation about progressivity in state and local taxes, particularly when a proposal lacks clear benefits along other dimensions. But the overall U.S. tax and transfer system is overwhelmingly progressive, and understanding the extent—and source—of that progressivity is essential for lawmakers considering the trade-offs associated with each tax policy decision.
Note: To read the full methodology and appendix, click “Download the PDF” above.
Stay informed on the tax policies impacting you.
Subscribe to get insights from our trusted experts delivered straight to your inbox.
Subscribe[1] Andrew Chamberlain and Gerald Prante, “Who Pays Taxes and Who Receives Government Spending? An Analysis of Federal, State and Local Tax and Spending Distributions, 1991-2004,” Tax Foundation, March 22, 2007, https://taxfoundation.org/who-pays-taxes-and-who-receives-government-spending-analysis-federal-state-and-local-tax-and/.
[2] See Appendix C, Table 4, for a detailed breakdown of household tax burdens by tax type.
[3] See Appendix C, Table 5 for a detailed account of effective fiscal incidence rates by type of tax for each income quintile before transfers.
[4] To see how much each quintile received in total gross transfers and at each level of government, refer to Appendix F, Figure 1.
[5] Refer to Appendix F, Figure 2 for each quintile’s share of redistributed market income after taxes.
[6] Refer to Appendix C, Table 6 for a detailed account of effective fiscal incidence rates by type of tax for each income quintile after transfers.
[7] Refer to Appendix F, Figure 3 for the average net transfer amount per household by quintile.
[8] Refer to Appendix F, Figure 4 for effective government transfer rates by quintile.
[9] See U.S. Bureau of Labor Statistics, “Consumer Expenditure Survey, CE Methods,” last updated Sept. 9, 2021, https://www.bls.gov/cex/pumd-getting-started-guide.htm#_edn7.
[10] See United States Census Bureau, “Annual Social and Economic Supplement (ASEC) of the Current Population Survey (CPS),” last updated Oct. 8, 2021, https://www.census.gov/programs-surveys/saipe/guidance/model-input-data/cpsasec.html.
[11] Sarah Flood, Miriam King, Renae Rodgers, Steven Ruggles, J. Robert Warren, and Michael Westberry, Integrated Public Use Microdata Series, Current Population Survey: Version 10.0 (Minneapolis, MN, 2022), https://doi.org/10.18128/D030.V10.0.
[12] U.S. Bureau of Labor Statistics, “Consumer Expenditure Surveys: CE Methods, PUMD Data Files,” last updated Nov. 8, 2022, https://www.bls.gov/cex/pumd_data.htm#stata.
[13] For the full list of NIPA tables referenced, see Appendix A.
[14] Centers for Medicare and Medicaid Services, “Financial Management Report for FY 2019,” last updated December 6, 2022, https://www.medicaid.gov/medicaid/financial-management/state-expenditure-reporting-for-medicaid-chip/expenditure-reports-mbescbes/index.html.
[15] Social Security Administration, Annual Statistical Supplement to the Social Security Bulletin, 2020, last updated Dec. 6, 2022, https://www.ssa.gov/policy/docs/statcomps/supplement/2020/index.html.
[16] U.S. Department of Veterans Affairs, “National Center for Veterans Analysis and Statistics: 2019 Expenditures,” last updated Dec. 6, 2022, https://www.va.gov/vetdata/expenditures.asp.
[17] See Bureau of Economic Analysis, “Net National Product,” https://www.bea.gov/help/glossary/net-national-product-nnp.
[18] Andrew Chamberlain and Gerald Prante, “Who Pays Taxes and Who Receives Government Spending? An Analysis of Federal, State and Local Tax and Spending Distributions, 1991-2004,” Tax Foundation, March 2007.
[19] For specific transfer amounts see Appendix B, Table 3.
[20] Price elasticity relates the percentage change in quantity demanded (or supplied) to the percentage change in price. If a good is price inelastic, then a 10 percent increase in price would result in a less than 10 percent decrease in the quantity of goods purchased. A good is price elastic when a 10 percent increase in price results in a greater than 10 percent decrease in the quantity of goods purchased. A good is unit elastic if a 10 percent increase in price would result in a 10 percent decrease in the quantity of goods purchased. Elasticity is thus a function of a consumer’s (or a producer’s) willingness to pay for a good or service (or business input) and can be affected by such things as necessity, preference, or substitutability. If the price elasticity of supply is greater than the price elasticity of demand, the consumer will bear a greater share of the tax than the producer. Conversely, if the price elasticity of demand is greater than the price elasticity of supply, the producer will bear more of the tax. The ability of a producer to pass on a tax to a consumer and the willingness of the consumer to bear a tax is thus a function of overall price competitiveness, the preferences of individual consumers, and the availability of suitable substitutes.
[21] Factors of production include land, labor, and capital. (Some also include entrepreneurship as a factor of production.)
[22] See Bureau of Economic Analysis, “Net National Product,” https://www.bea.gov/help/glossary/net-national-product-nnp.
Share